Bordertown SA 5268
This Bordertown suburb profile includes demographic data and planning information to help you make an informed property decision.
An average home in Bordertown is owned with a mortgage by couples without children. The average age in Bordertown is 40. Separate houses are common in Bordertown and the area is mostly RURAL (90.21%), RURAL LIVING (2.84%) and NEIGHBOURHOOD (1.97%).
Bordertown demographics
Population
3095
Average Age
40
Age Distribution
Employment Type
Median Weekly Income
Traveled to Work
Car
81.4%
Tram
0.0%
Bicycle
1.2%
Train
0.0%
Walking
4.6%
Bus
0.3%
Bordertown property information
Number of Bedrooms
Tenure Type
Property Types in Bordertown
Separate house
Semi detached house
Unit/Apartment
Median monthly mortgage repayments
$884
Median weekly rental payments
$220
Average number of bedrooms per dwelling
3.1
Average number of people per household
2
Household Composition
Family Composition
Couple family without children
One parent family
Couple family with children
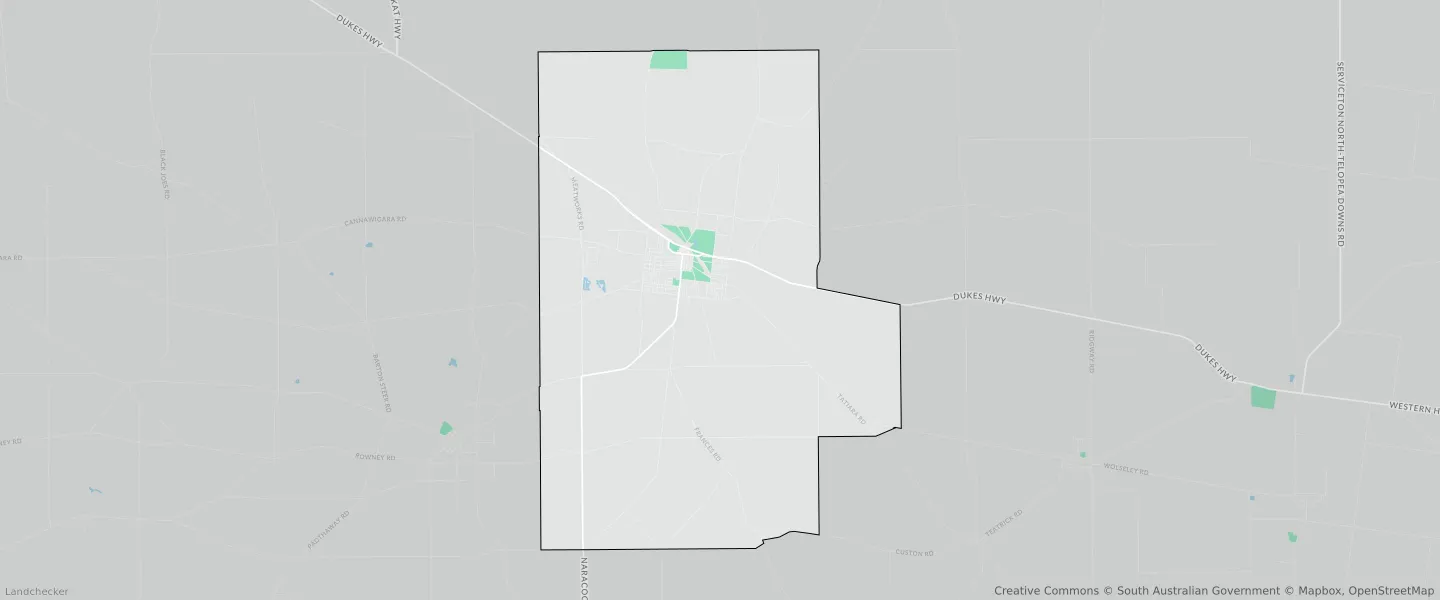
BORDERTOWN planning zones
| Zone Code | Zone Name | Percentage Covered | Area Covered | |
|---|---|---|---|---|
| CF | COMMUNITY FACILITIES | 0.68% | 959,517.01㎡ | |
| CTP | CARAVAN AND TOURIST PARK | 0.02% | 27,111.63㎡ | |
| DU | DEFERRED URBAN | 0.42% | 597,291.98㎡ | |
| E | EMPLOYMENT | 0.49% | 687,982.52㎡ | |
| E-BH | EMPLOYMENT (BULK HANDLING) | 0.2% | 281,315.99㎡ | |
| INF | INFRASTRUCTURE | 0.75% | 1,067,172.94㎡ | |
| N | NEIGHBOURHOOD | 1.97% | 2,789,387.6㎡ | |
| REC | RECREATION | 0.73% | 1,028,270㎡ | |
| RU | RURAL | 90.21% | 127,850,955.73㎡ | |
| RUIE | RURAL INTENSIVE ENTERPRISE | 0.88% | 1,247,166.9㎡ | |
| RUL | RURAL LIVING | 2.84% | 4,021,911.66㎡ | |
| SE | STRATEGIC EMPLOYMENT | 0.66% | 928,577.88㎡ | |
| TAC | TOWNSHIP ACTIVITY CENTRE | 0.17% | 239,344.7㎡ |
Looking to research a property in BORDERTOWN?
Go to mapData Source - ABS