Boondall QLD 4034
This Boondall suburb profile includes demographic data and planning information to help you make an informed property decision.
An average home in Boondall is owned with a mortgage by couples with children. The average age in Boondall is 38. Separate houses are common in Boondall and the area is mostly Conservation (30.16%), Low density residential (19.27%) and Community facilities (9.21%).
Boondall demographics
Population
9603
Average Age
38
Age Distribution
Employment Type
Median Weekly Income
Traveled to Work
Car
80.6%
Tram
0.0%
Bicycle
0.9%
Train
5.6%
Walking
2.1%
Bus
1.4%
Boondall property information
Number of Bedrooms
Tenure Type
Property Types in Boondall
Separate house
Semi detached house
Unit/Apartment
Median monthly mortgage repayments
$1,800
Median weekly rental payments
$415
Average number of bedrooms per dwelling
3.4
Average number of people per household
3
Household Composition
Family Composition
Couple family without children
One parent family
Couple family with children
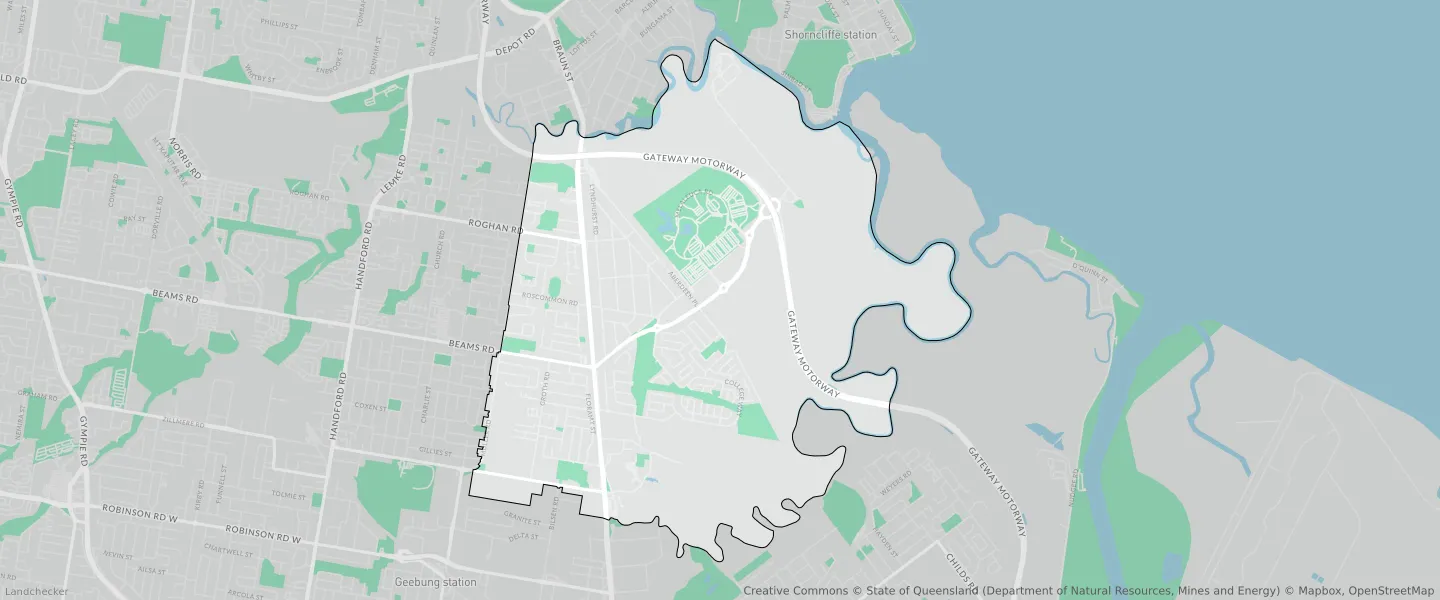
BOONDALL planning zones
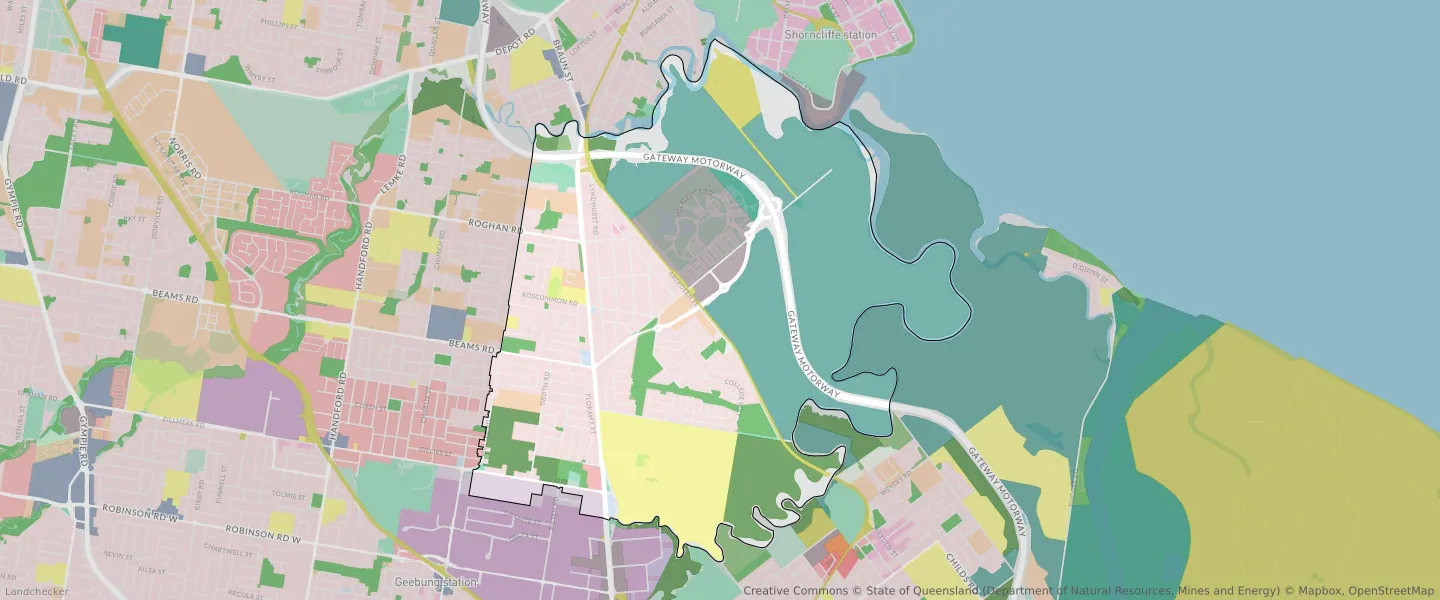
| Zone Code | Zone Name | Percentage Covered | Area Covered | |
|---|---|---|---|---|
| CF | Community facilities | 9.21% | 1,010,088.1㎡ | |
| CN | Conservation | 30.16% | 3,306,868.2㎡ | |
| CR | Character residential | 0.04% | 4,900.07㎡ | |
| EC | Emerging community | 0.96% | 105,529.73㎡ | |
| EM | Environmental management | 6.2% | 679,702.56㎡ | |
| LDR | Low density residential | 19.27% | 2,111,999.93㎡ | |
| LII | Low impact industry | 1.43% | 157,042.46㎡ | |
| LMR | Low-medium density residential | 0.28% | 30,484.94㎡ | |
| NC | Neighbourhood centre | 0.19% | 20,589.64㎡ | |
| OS | Recreation and open space | 3.52% | 385,368.71㎡ | |
| RU | Rural | 0.02% | 2,033.21㎡ | |
| SC | Specialised centre | 5.97% | 654,732.08㎡ | |
| SP | Special purpose | 2.65% | 290,365.11㎡ | |
| SR | Sport and recreation | 0.56% | 61,456.36㎡ |
Looking to research a property in BOONDALL?
Go to mapData Source - ABS