Boolaroo NSW 2284
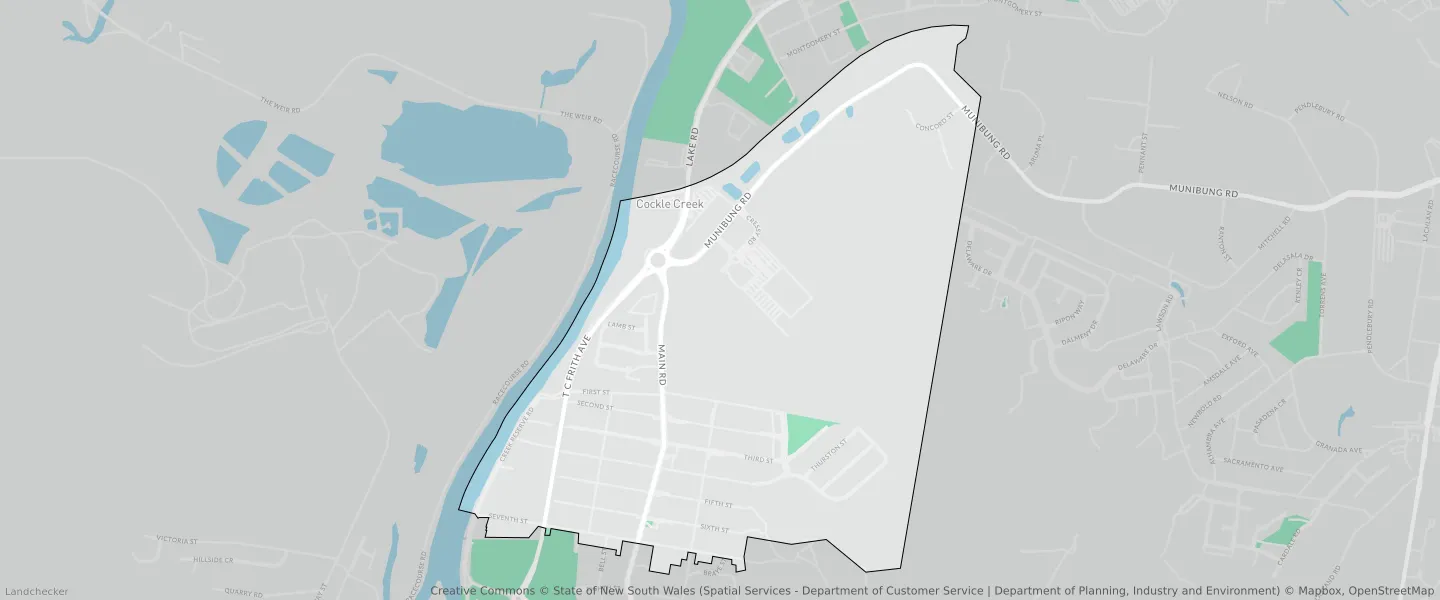
This Boolaroo suburb profile includes demographic data and planning information to help you make an informed property decision.
An average home in Boolaroo is owned with a mortgage by couples without children. The average age in Boolaroo is 39. Separate houses are common in Boolaroo and the area is mostly Environmental Living (40.66%), General Industrial (12.08%) and Environmental Conservation (10.53%).
Boolaroo demographics
Population
1636
Average Age
39
Age Distribution
Employment Type
Median Weekly Income
Traveled to Work
Car
89.2%
Tram
0.0%
Bicycle
0.0%
Train
0.0%
Walking
2.3%
Bus
1.5%
Boolaroo property information
Number of Bedrooms
Tenure Type
Property Types in Boolaroo
Separate house
Semi detached house
Unit/Apartment
Median monthly mortgage repayments
$1,907
Median weekly rental payments
$400
Average number of bedrooms per dwelling
3.0
Average number of people per household
2
Household Composition
Family Composition
Couple family without children
One parent family
Couple family with children
BOOLAROO planning zones
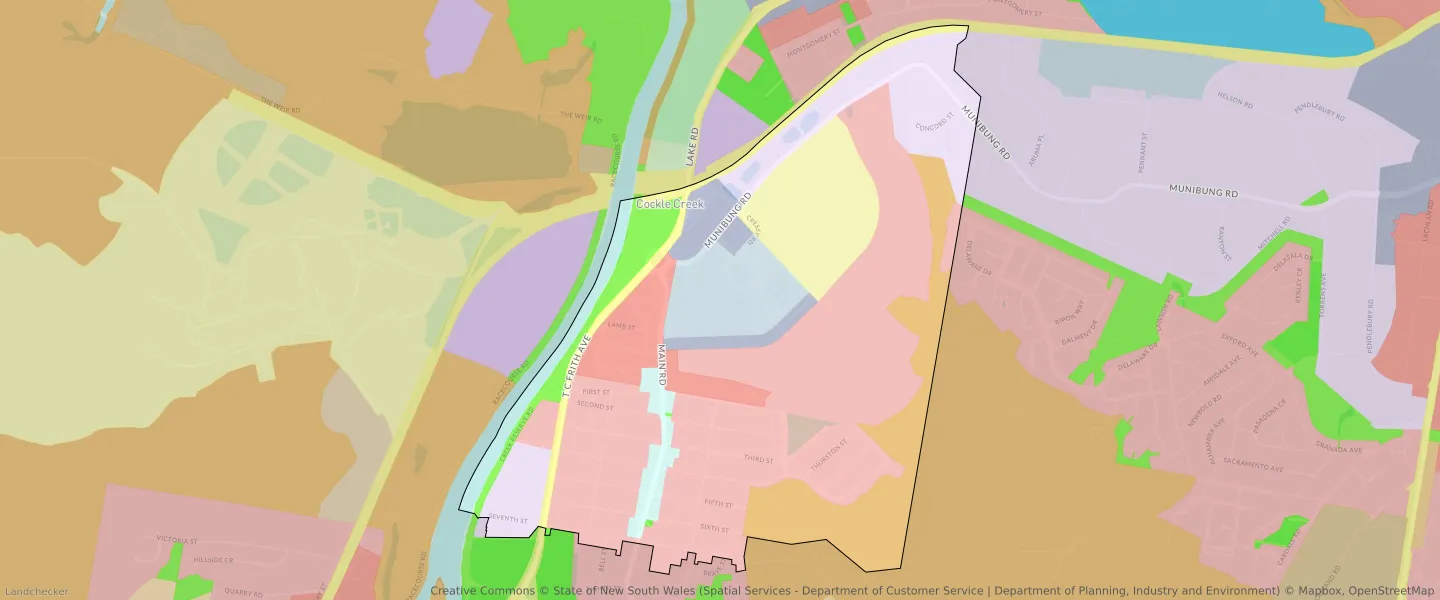
| Zone Code | Zone Name | Percentage Covered | Area Covered | |
|---|---|---|---|---|
| C2 | Environmental Conservation | 10.53% | 284,602.26㎡ | |
| E1 | Local Centre | 2.2% | 59,457.41㎡ | |
| E3 | Business Development | 6.22% | 168,091.68㎡ | |
| E4 | General Industrial | 12.08% | 326,436.96㎡ | |
| MU1 | Mixed Use | 3.67% | 99,221.86㎡ | |
| R2 | Environmental Living | 40.66% | 1,098,969.26㎡ | |
| R3 | Medium Density Residential | 7.14% | 192,939.3㎡ | |
| RE1 | Low Density Residential | 3.53% | 95,374.54㎡ | |
| SP1 | Infrastructure | 8.46% | 228,745.83㎡ | |
| SP2 | Infrastructure | 2.99% | 80,842.29㎡ | |
| W1 | Environmental Living | 2.52% | 68,018.54㎡ |
Looking to research a property in BOOLAROO?
Go to mapData Source - ABS