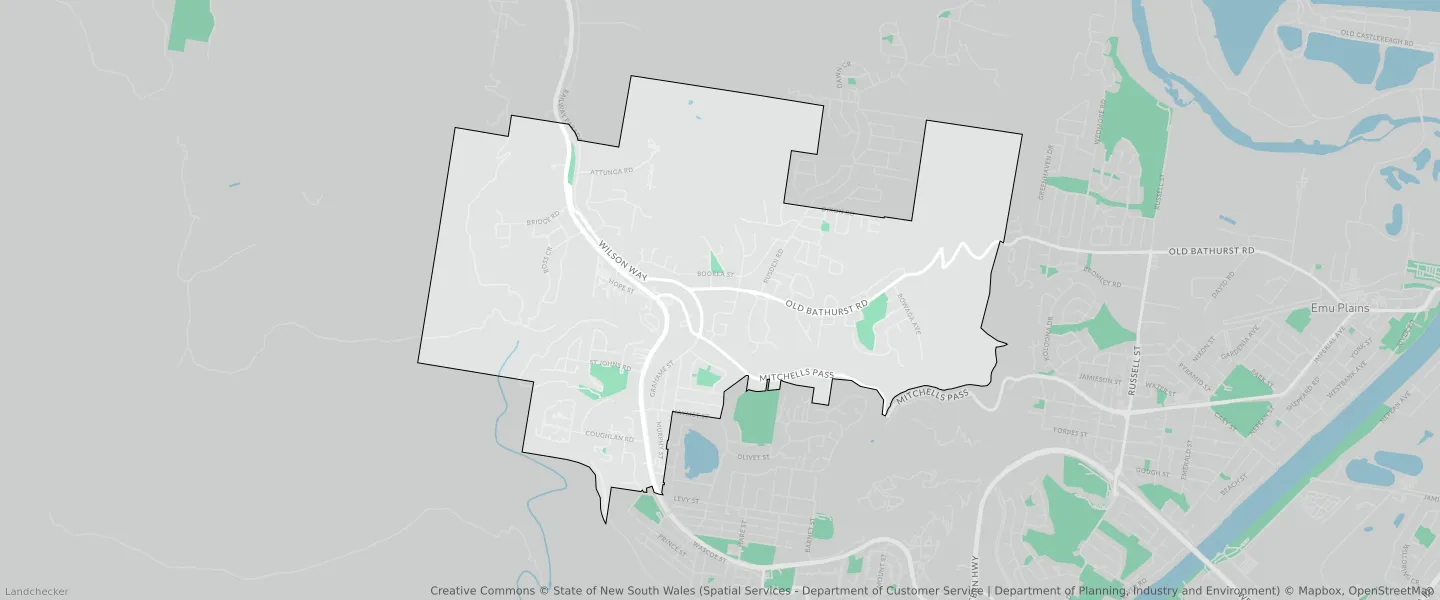
Blaxland NSW 2774
This Blaxland suburb profile includes demographic data and planning information to help you make an informed property decision.
An average home in Blaxland is owned with a mortgage by couples with children. The average age in Blaxland is 41. Separate houses are common in Blaxland and the area is mostly Environmental Conservation (45.87%), Environmental Living (21.68%) and Environmental Living (15.28%).
Blaxland demographics
Population
7434
Average Age
41
Age Distribution
Employment Type
Median Weekly Income
Traveled to Work
Car
85.6%
Tram
0.0%
Bicycle
0.4%
Train
3.4%
Walking
1.9%
Bus
0.0%
Blaxland property information
Number of Bedrooms
Tenure Type
Property Types in Blaxland
Separate house
Semi detached house
Unit/Apartment
Median monthly mortgage repayments
$2,230
Median weekly rental payments
$420
Average number of bedrooms per dwelling
3.5
Average number of people per household
3
Household Composition
Family Composition
Couple family without children
One parent family
Couple family with children
BLAXLAND planning zones
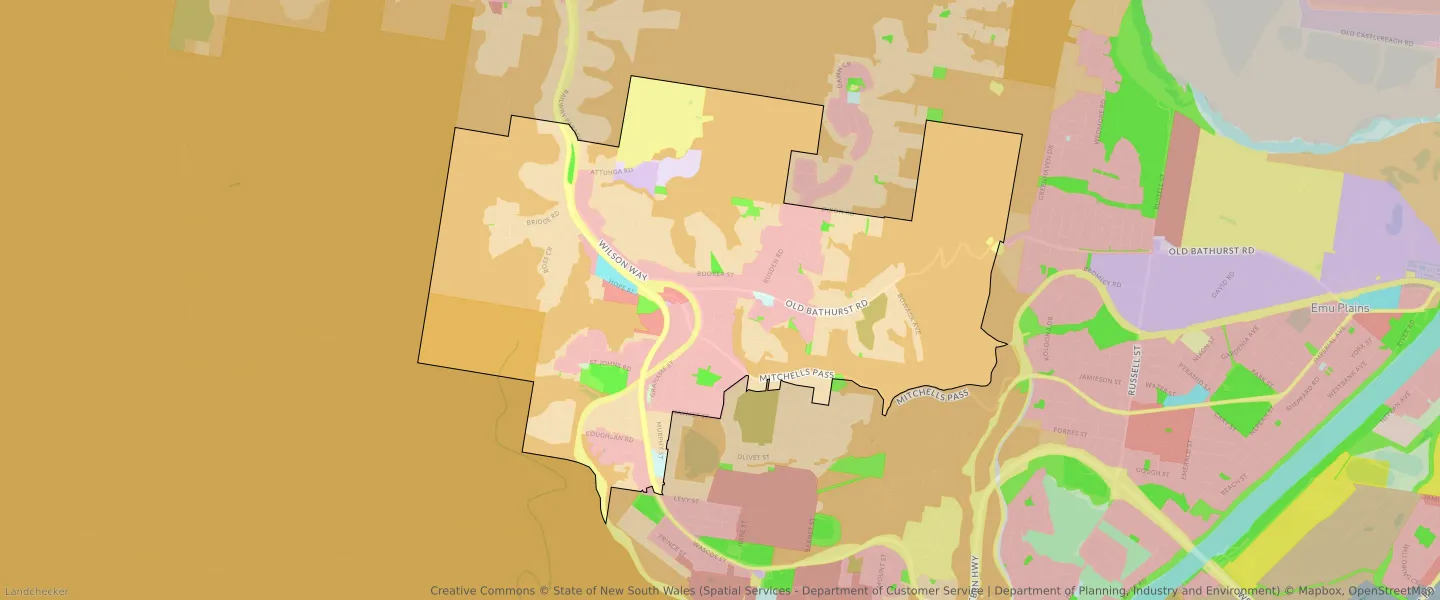
| Zone Code | Zone Name | Percentage Covered | Area Covered | |
|---|---|---|---|---|
| C1 | National Parks and Nature Reserves | 5.33% | 524,927.23㎡ | |
| C2 | Environmental Conservation | 45.87% | 4,513,430.97㎡ | |
| C4 | Environmental Living | 21.68% | 2,133,451.6㎡ | |
| E1 | Local Centre | 0.33% | 32,648.67㎡ | |
| E2 | Commercial Centre | 0.42% | 41,099.42㎡ | |
| E4 | General Industrial | 1.29% | 127,063.71㎡ | |
| R2 | Environmental Living | 15.28% | 1,503,867.49㎡ | |
| R3 | Medium Density Residential | 0.83% | 82,151.78㎡ | |
| RE1 | Low Density Residential | 1.7% | 167,019.56㎡ | |
| RE2 | Private Recreation | 0.08% | 8,037.01㎡ | |
| SP2 | Infrastructure | 7.18% | 706,224.91㎡ |
Looking to research a property in BLAXLAND?
Go to mapData Source - ABS