Bingleburra NSW 2311
This Bingleburra suburb profile includes demographic data and planning information to help you make an informed property decision.
An average home in Bingleburra is owned with a mortgage by couples without children. The average age in Bingleburra is 58. Separate houses are common in Bingleburra and the area is mostly Primary Production (99.65%) and Environmental Conservation (0.35%).
Bingleburra demographics
Population
36
Average Age
58
Age Distribution
Employment Type
Median Weekly Income
Traveled to Work
Car
133.3%
Tram
0.0%
Bicycle
0.0%
Train
0.0%
Walking
0.0%
Bus
0.0%
Bingleburra property information
Number of Bedrooms
Tenure Type
Property Types in Bingleburra
Separate house
Semi detached house
Unit/Apartment
Median monthly mortgage repayments
$1,300
Median weekly rental payments
$450
Average number of bedrooms per dwelling
3.0
Average number of people per household
3
Household Composition
Family Composition
Couple family without children
One parent family
Couple family with children
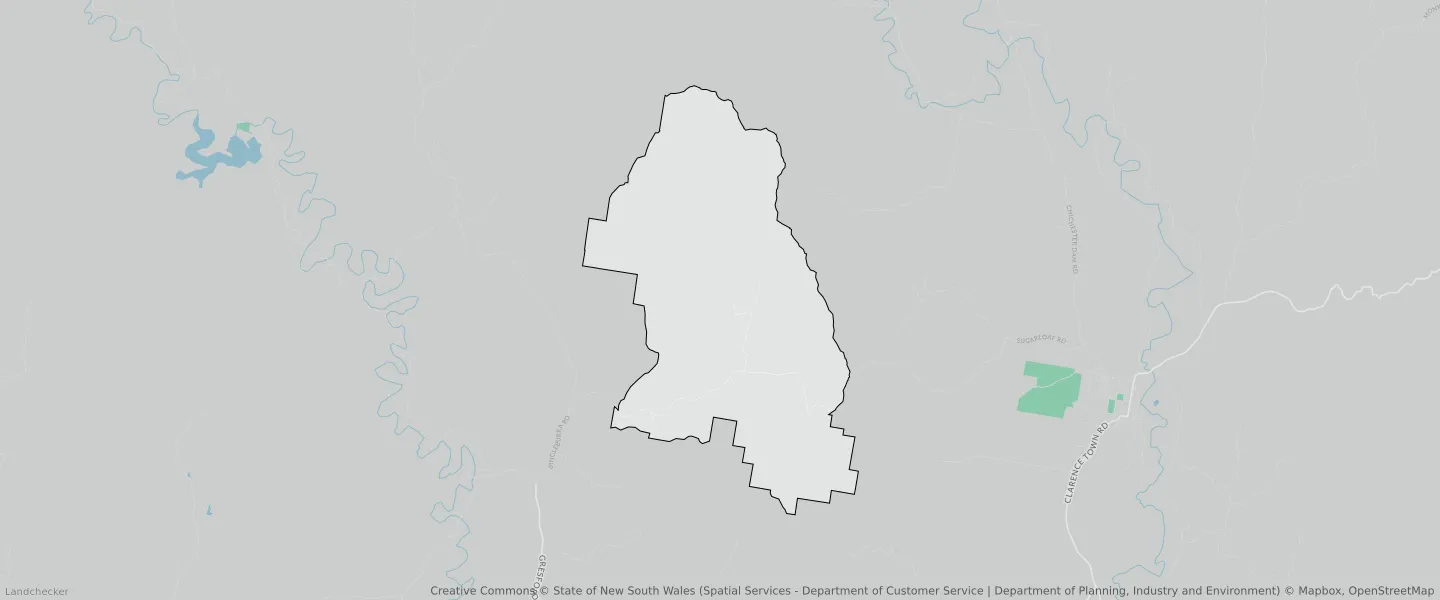
BINGLEBURRA planning zones
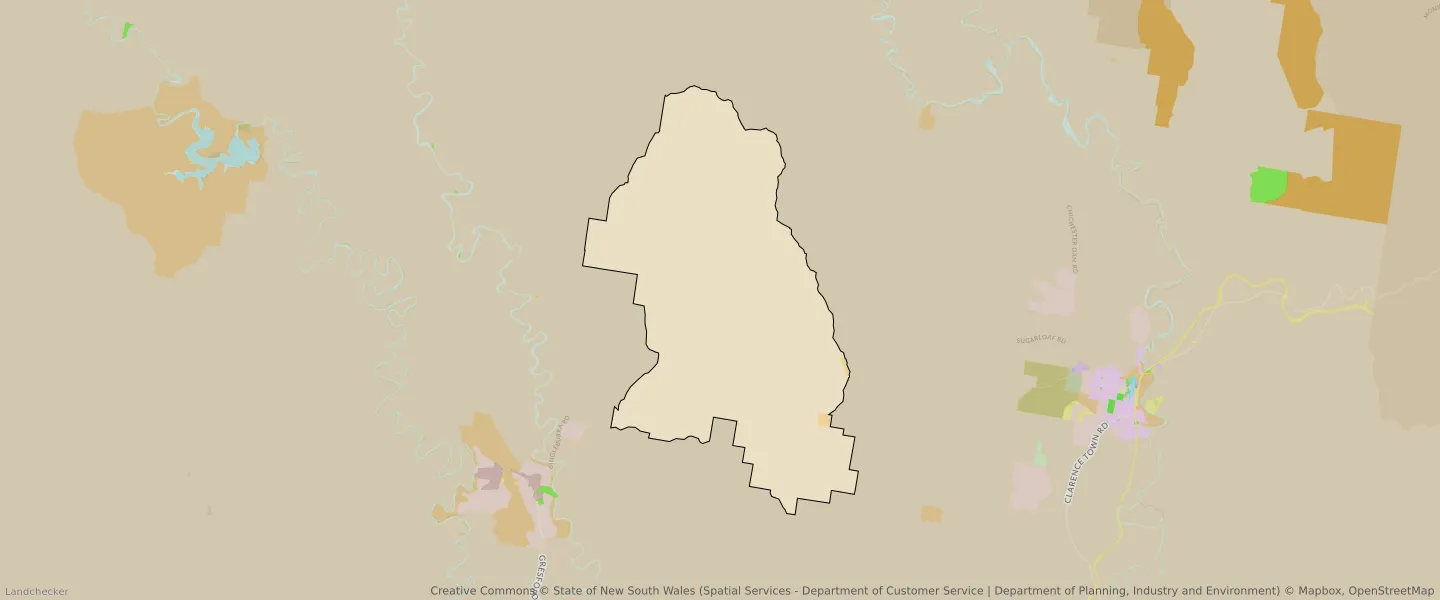
| Zone Code | Zone Name | Percentage Covered | Area Covered | |
|---|---|---|---|---|
| C3 | Environmental Conservation | 0.35% | 238,384.38㎡ | |
| RU1 | Primary Production | 99.65% | 68,495,451.09㎡ |
Looking to research a property in BINGLEBURRA?
Go to mapData Source - ABS