Belford NSW 2335
This Belford suburb profile includes demographic data and planning information to help you make an informed property decision.
An average home in Belford is owned with a mortgage by couples with children. The average age in Belford is 44. Separate houses are common in Belford and the area is mostly Primary Production (59.72%), National Parks and Nature Reserves (18.44%) and Primary Production Small Lots (17.64%).
Belford demographics
Population
176
Average Age
44
Age Distribution
Employment Type
Median Weekly Income
Traveled to Work
Car
77.0%
Tram
0.0%
Bicycle
0.0%
Train
0.0%
Walking
11.5%
Bus
0.0%
Belford property information
Number of Bedrooms
Tenure Type
Property Types in Belford
Separate house
Semi detached house
Unit/Apartment
Median monthly mortgage repayments
$2,447
Median weekly rental payments
$530
Average number of bedrooms per dwelling
3.8
Average number of people per household
3
Household Composition
Family Composition
Couple family without children
One parent family
Couple family with children
BELFORD planning zones
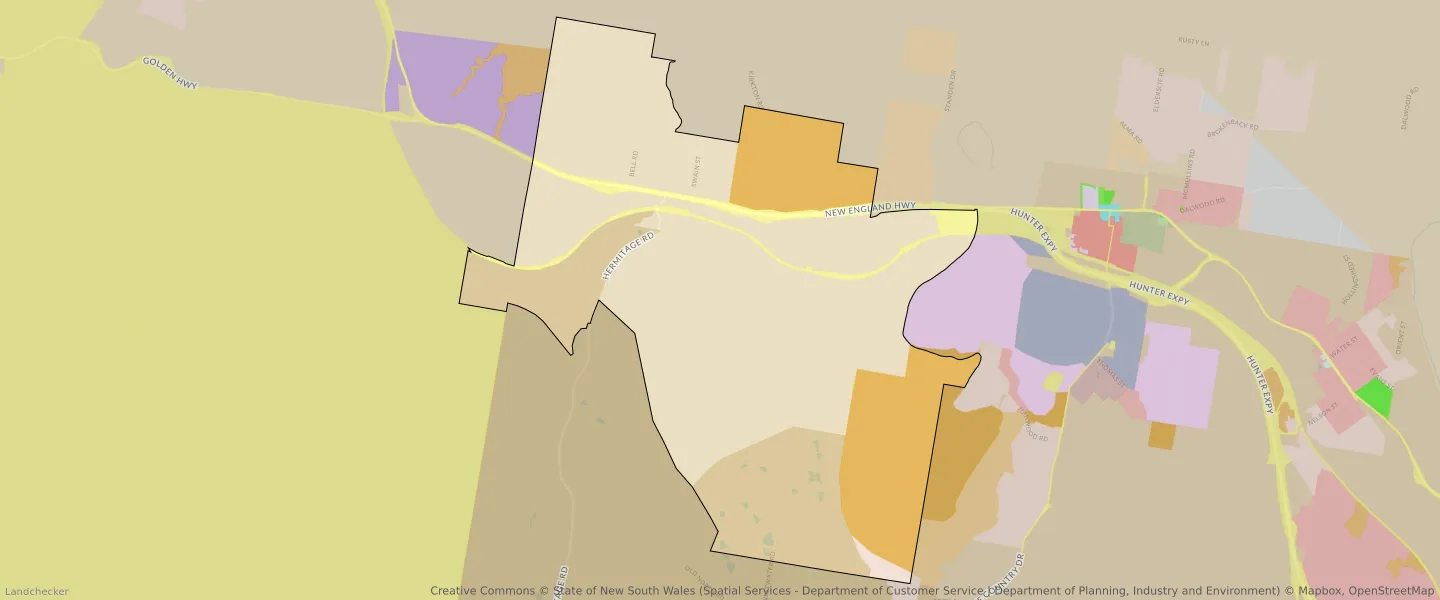
| Zone Code | Zone Name | Percentage Covered | Area Covered | |
|---|---|---|---|---|
| C1 | National Parks and Nature Reserves | 18.44% | 7,337,710.56㎡ | |
| R5 | Large Lot Residential | 0.62% | 244,824.2㎡ | |
| RU1 | Primary Production | 59.72% | 23,769,015.58㎡ | |
| RU4 | Primary Production Small Lots | 17.64% | 7,020,441.03㎡ | |
| SP2 | Infrastructure | 3.58% | 1,423,043.65㎡ |
Looking to research a property in BELFORD?
Go to mapData Source - ABS