Bangalow NSW 2479
This Bangalow suburb profile includes demographic data and planning information to help you make an informed property decision.
An average home in Bangalow is owned with a mortgage by couples with children. The average age in Bangalow is 40. Separate houses are common in Bangalow and the area is mostly Rural Landscape (48.62%), Primary Production (40.6%) and Environmental Living (4.23%).
Bangalow demographics
Population
2752
Average Age
40
Age Distribution
Employment Type
Median Weekly Income
Traveled to Work
Car
85.2%
Tram
0.0%
Bicycle
0.0%
Train
0.0%
Walking
7.8%
Bus
0.5%
Bangalow property information
Number of Bedrooms
Tenure Type
Property Types in Bangalow
Separate house
Semi detached house
Unit/Apartment
Median monthly mortgage repayments
$2,170
Median weekly rental payments
$650
Average number of bedrooms per dwelling
3.2
Average number of people per household
3
Household Composition
Family Composition
Couple family without children
One parent family
Couple family with children
BANGALOW planning zones
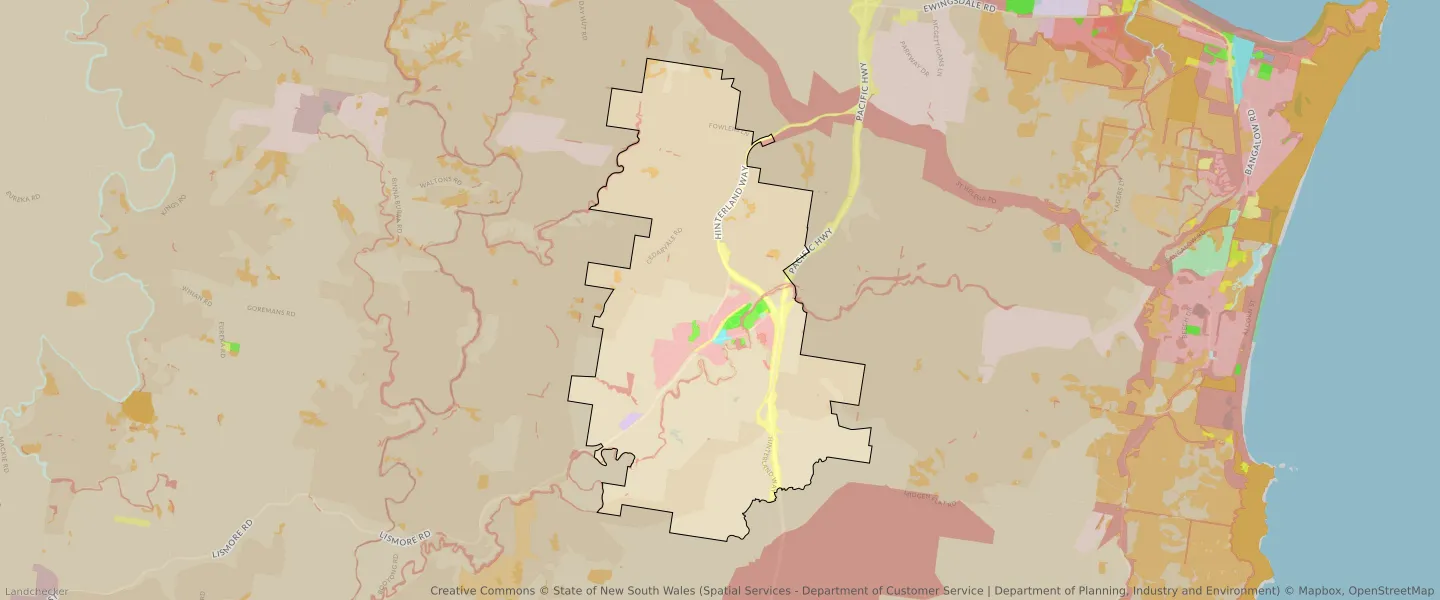
| Zone Code | Zone Name | Percentage Covered | Area Covered | |
|---|---|---|---|---|
| C2 | Environmental Conservation | 0.69% | 166,262.09㎡ | |
| C3 | Environmental Conservation | 0.4% | 96,673.1㎡ | |
| DM | Deferred Matter | 0.11% | 26,862.75㎡ | |
| E1 | Local Centre | 0.19% | 45,044.47㎡ | |
| E4 | General Industrial | 0.29% | 68,853.31㎡ | |
| R2 | Environmental Living | 4.23% | 1,019,363.88㎡ | |
| R3 | Medium Density Residential | 0.16% | 38,530.2㎡ | |
| RE1 | Low Density Residential | 0.94% | 227,385.55㎡ | |
| RE2 | Private Recreation | 0.04% | 10,123.43㎡ | |
| RU1 | Primary Production | 40.6% | 9,778,090.02㎡ | |
| RU1 | Primary Production | 0% | 644.86㎡ | |
| RU2 | Rural Landscape | 48.62% | 11,712,711.18㎡ | |
| SP2 | Infrastructure | 3.66% | 881,523.93㎡ | |
| SP3 | Tourist | 0.01% | 1,966.24㎡ |
Looking to research a property in BANGALOW?
Go to mapData Source - ABS