Awaba NSW 2283
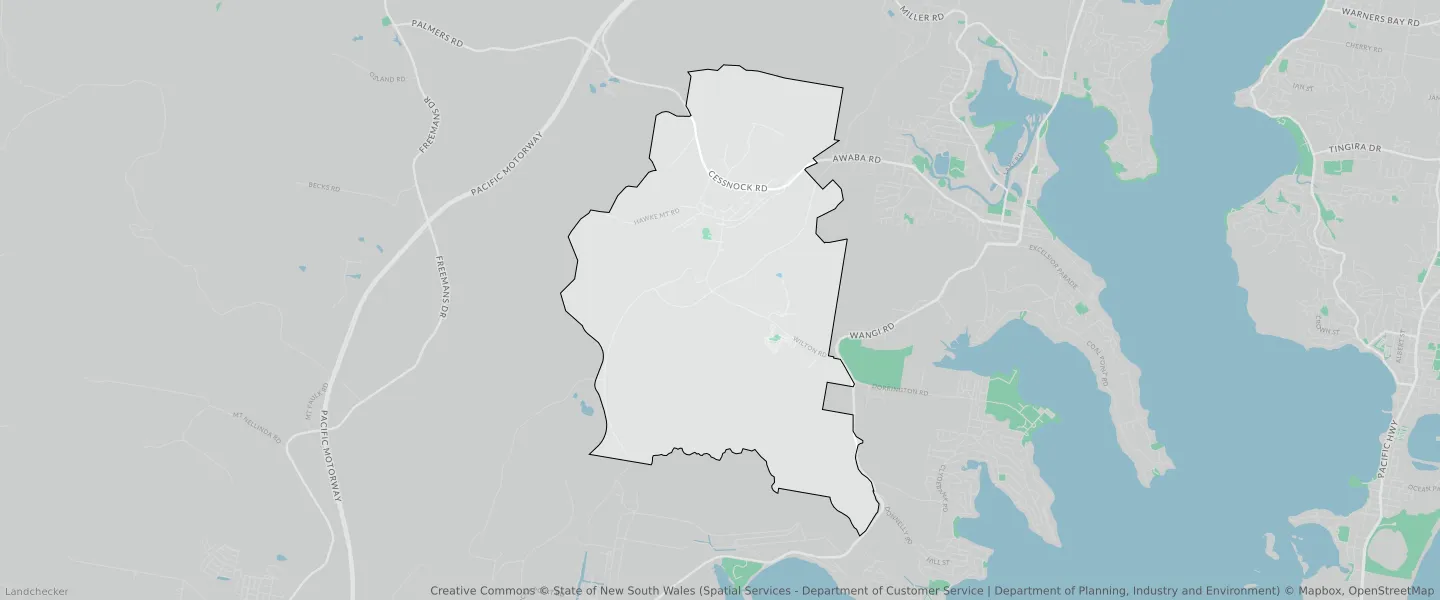
This Awaba suburb profile includes demographic data and planning information to help you make an informed property decision.
An average home in Awaba is owned with a mortgage by couples with children. The average age in Awaba is 40. Separate houses are common in Awaba and the area is mostly Environmental Conservation (69.38%), Infrastructure (10.04%) and Environmental Conservation (6.05%).
Awaba demographics
Population
430
Average Age
40
Age Distribution
Employment Type
Median Weekly Income
Traveled to Work
Car
91.8%
Tram
0.0%
Bicycle
0.0%
Train
0.0%
Walking
0.0%
Bus
0.0%
Awaba property information
Number of Bedrooms
Tenure Type
Property Types in Awaba
Separate house
Semi detached house
Unit/Apartment
Median monthly mortgage repayments
$1,755
Median weekly rental payments
$300
Average number of bedrooms per dwelling
3.2
Average number of people per household
3
Household Composition
Family Composition
Couple family without children
One parent family
Couple family with children
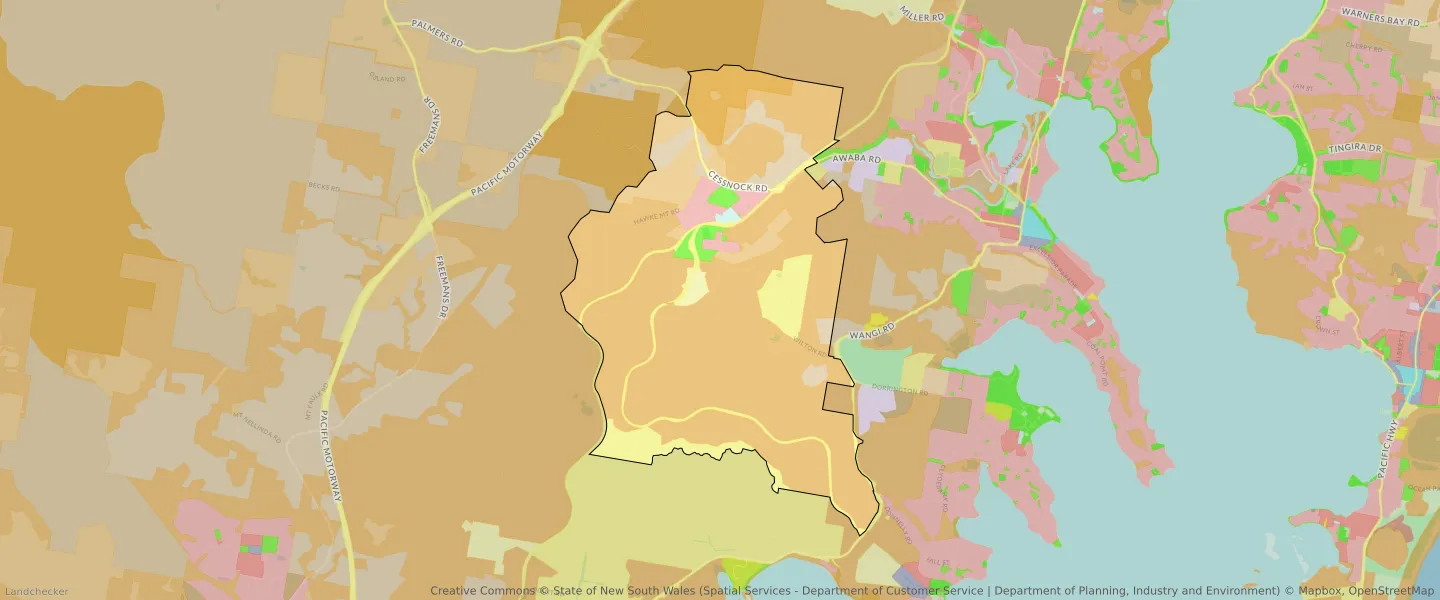
AWABA planning zones
| Zone Code | Zone Name | Percentage Covered | Area Covered | |
|---|---|---|---|---|
| C1 | National Parks and Nature Reserves | 4.4% | 1,017,598.03㎡ | |
| C2 | Environmental Conservation | 69.38% | 16,030,795.52㎡ | |
| C3 | Environmental Conservation | 6.05% | 1,398,030.95㎡ | |
| E1 | Local Centre | 0.27% | 62,324.05㎡ | |
| R2 | Environmental Living | 2.7% | 624,673.72㎡ | |
| RE1 | Low Density Residential | 1.44% | 333,690.6㎡ | |
| RU2 | Rural Landscape | 4.98% | 1,150,201.09㎡ | |
| SP1 | Infrastructure | 0.73% | 168,480.36㎡ | |
| SP2 | Infrastructure | 10.04% | 2,319,266.57㎡ |
Looking to research a property in AWABA?
Go to mapData Source - ABS