Adelaide SA 5000
This Adelaide suburb profile includes demographic data and planning information to help you make an informed property decision.
An average home in Adelaide is rented by single person households. The average age in Adelaide is 31. Units and Apartments are common in Adelaide and the area is mostly ADELAIDE PARK LANDS (54.89%), CAPITAL CITY (22.09%) and CITY RIVERBANK (8.37%).
Adelaide demographics
Population
18202
Average Age
31
Age Distribution
Employment Type
Median Weekly Income
Traveled to Work
Car
35.0%
Tram
3.8%
Bicycle
3.8%
Train
0.7%
Walking
37.9%
Bus
11.2%
Adelaide property information
Number of Bedrooms
Tenure Type
Property Types in Adelaide
Separate house
Semi detached house
Unit/Apartment
Median monthly mortgage repayments
$1,733
Median weekly rental payments
$400
Average number of bedrooms per dwelling
2.0
Average number of people per household
2
Household Composition
Family Composition
Couple family without children
One parent family
Couple family with children
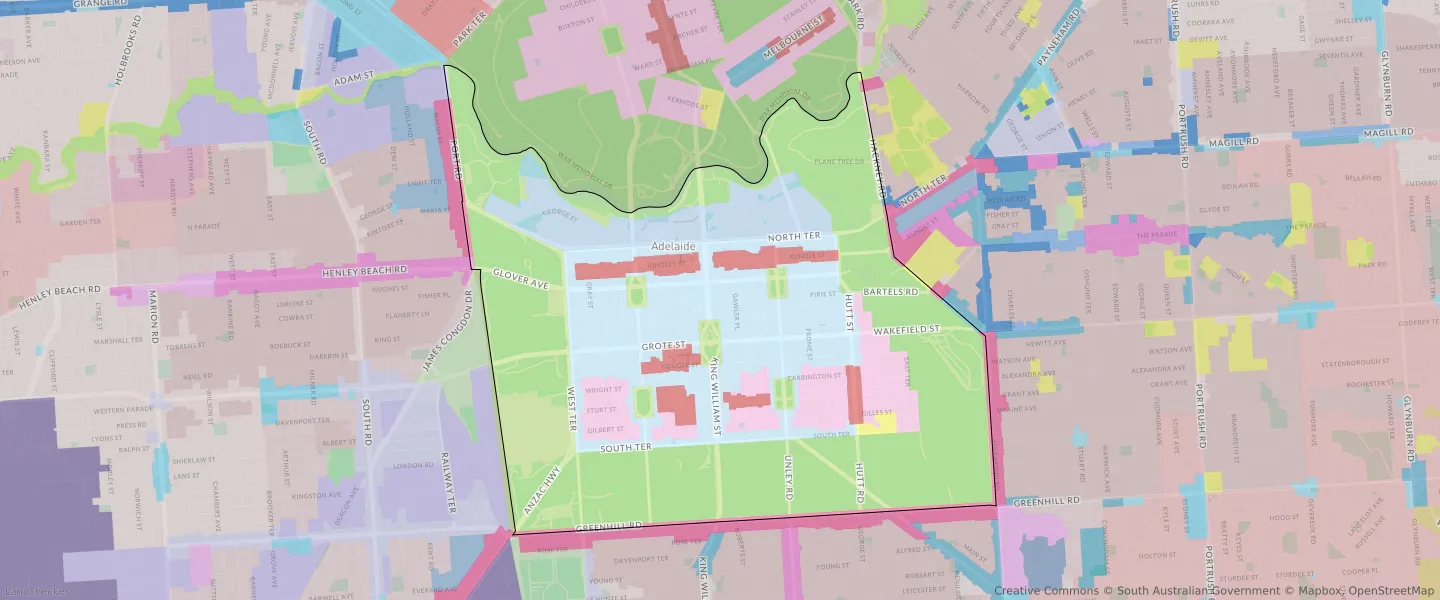
ADELAIDE planning zones
| Zone Code | Zone Name | Percentage Covered | Area Covered | |
|---|---|---|---|---|
| APL | ADELAIDE PARK LANDS | 54.89% | 5,701,346.02㎡ | |
| BN | BUSINESS NEIGHBOURHOOD | 0.08% | 8,243.56㎡ | |
| CC | CAPITAL CITY | 22.09% | 2,294,954.38㎡ | |
| CF | COMMUNITY FACILITIES | 0.43% | 45,142.86㎡ | |
| CL | CITY LIVING | 7.98% | 829,325.84㎡ | |
| CMS | CITY MAIN STREET | 4.51% | 468,353.63㎡ | |
| CR | CITY RIVERBANK | 8.37% | 869,827.28㎡ | |
| EN | ESTABLISHED NEIGHBOURHOOD | 0.14% | 14,972.87㎡ | |
| OS | OPEN SPACE | 0.02% | 2,170.99㎡ | |
| REC | RECREATION | 0% | 117.36㎡ | |
| SAC | SUBURBAN ACTIVITY CENTRE | 0% | 27.96㎡ | |
| SB | SUBURBAN BUSINESS | 0.02% | 2,536.89㎡ | |
| UC-BO | URBAN CORRIDOR (BOULEVARD) | 1.43% | 148,255.04㎡ | |
| UC-MS | URBAN CORRIDOR (MAIN STREET) | 0.02% | 2,525.56㎡ |
Looking to research a property in ADELAIDE?
Go to mapData Source - ABS