landchecker in your state

New South Wales

property

planning

permit/DA

imagery

data,

all

in

one

place.
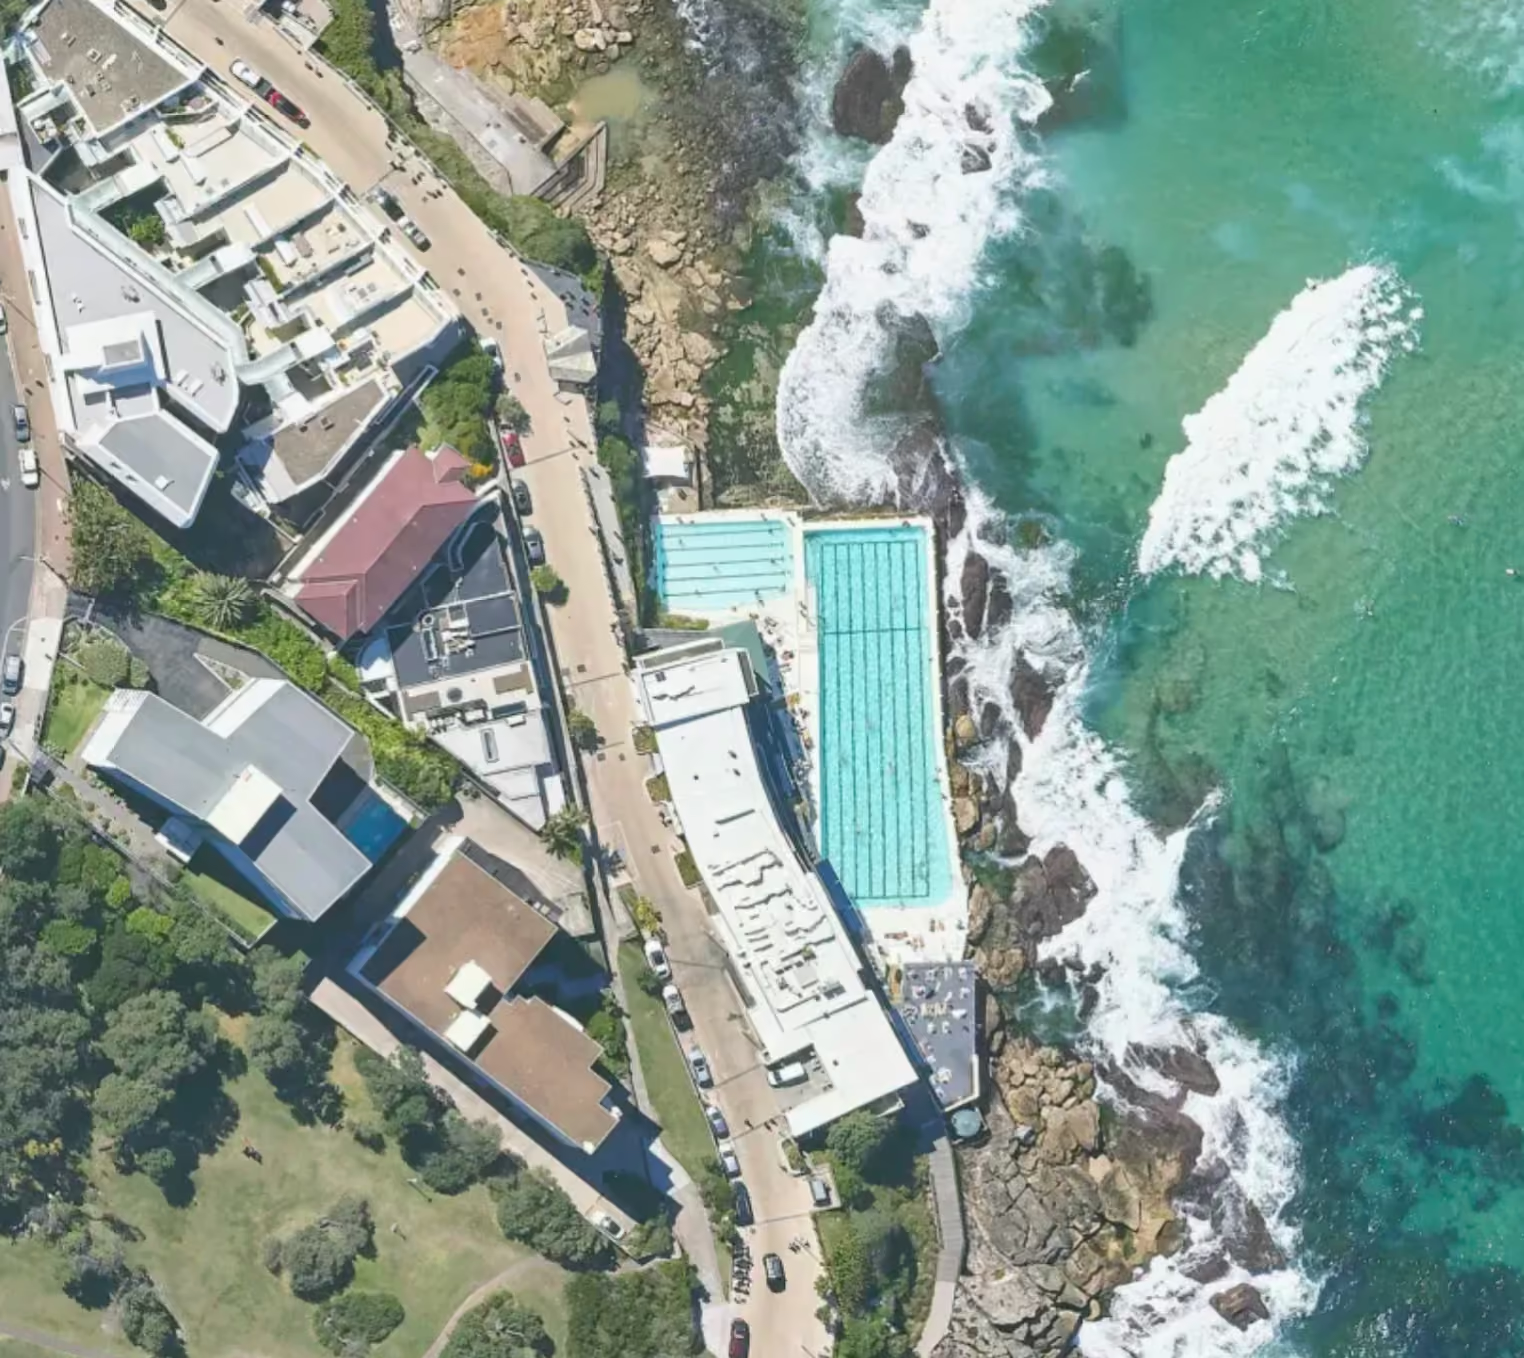
Aerial view of a coastal area featuring a rectangular outdoor swimming pool beside rocky shoreline with ocean waves, adjacent to buildings and roads.

Checking the zone on a site in Parramatta, tracing an easement on a deposited plan in Newcastle or shortlisting development sites on the Central Coast shouldn't mean opening six council portals and a registry website to do it.

We bring NSW planning controls, zoning, boundaries, sales history, aerial imagery and NSW Land Registry Services documents together on a single interactive map. Developers, planners, conveyancers, valuers and agents use it to read a site and order the documents they need in the same session.

Join for free today and start searching any property in New South Wales.

Every NSW Property on One Interactive Map

Landchecker covers all of New South Wales, from the Sydney CBD to regional council areas, with the same tools and the same interface everywhere.

Search by address, lot and plan number, or title reference, and the map returns the subject property with:

  • Legal property boundaries drawn over high-resolution imagery
  • Land size in metres squared, acres and hectares
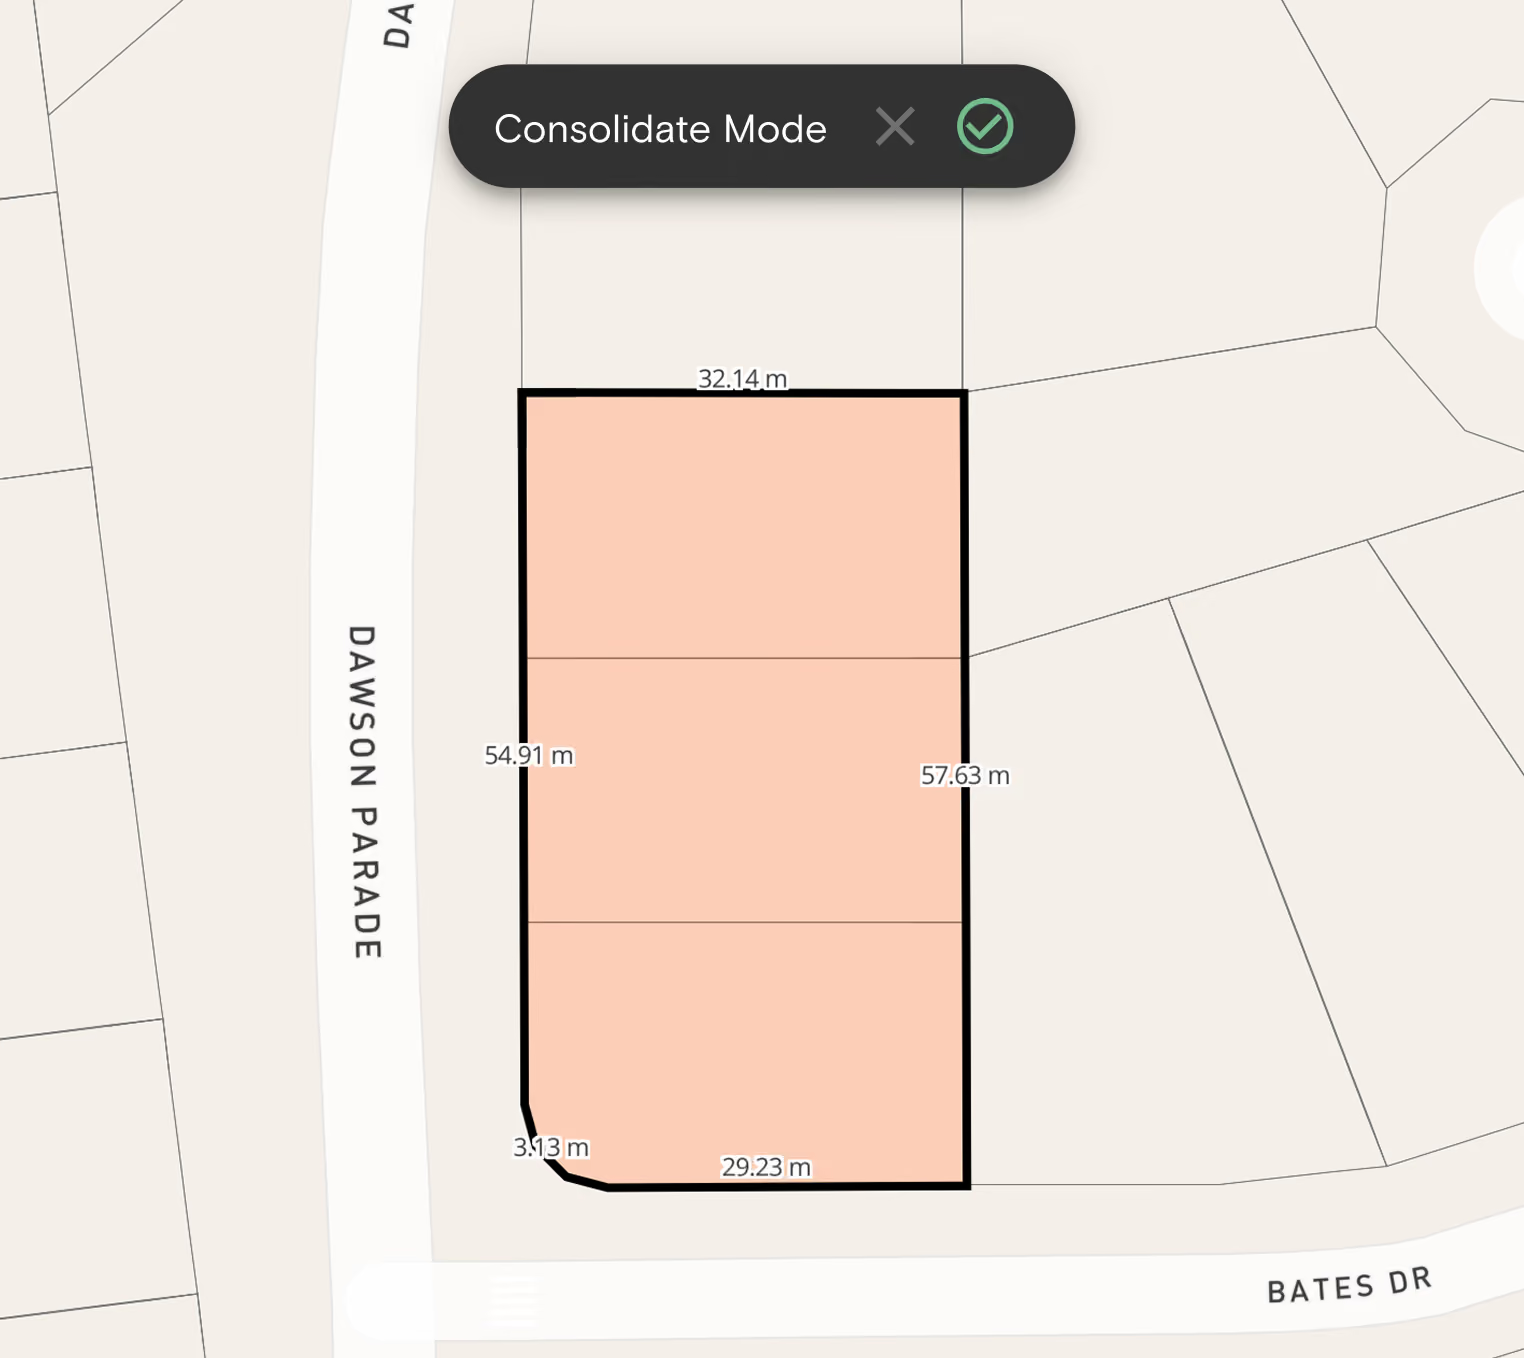
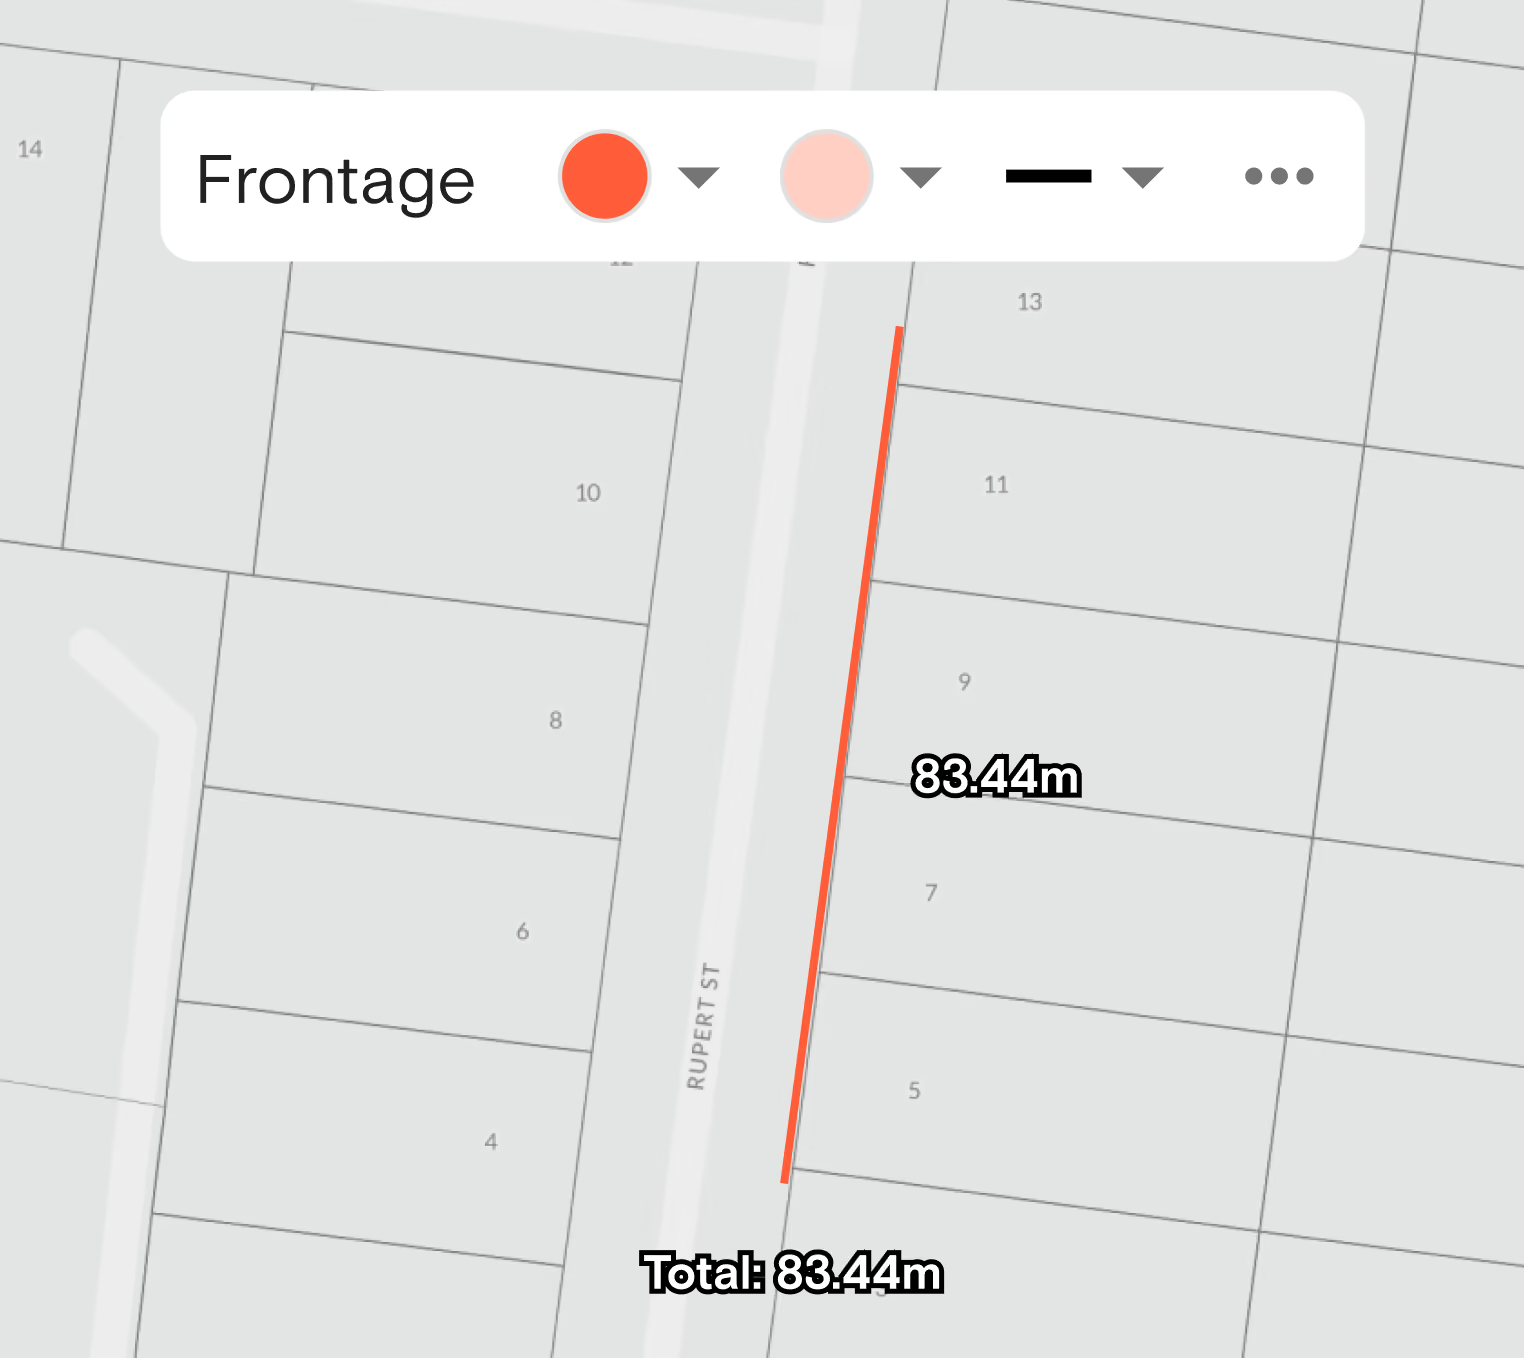
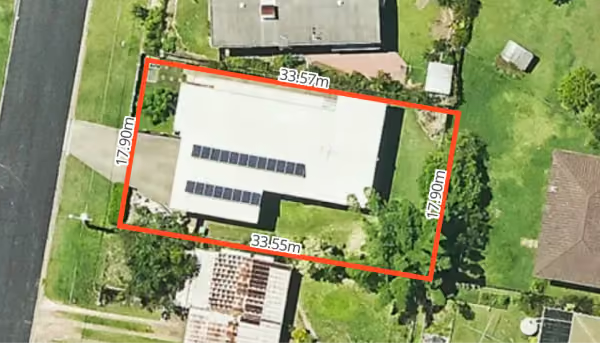
  • Site dimensions, so you can check frontage and depth without a site visit
  • Lot and plan identifiers, ready to drop straight into a document order
  • The local government area and the planning instrument that applies

Rather than digging through council maps and PDFs, you get accurate boundary data for every New South Wales property in one place, so you can check, verify and decide in seconds.
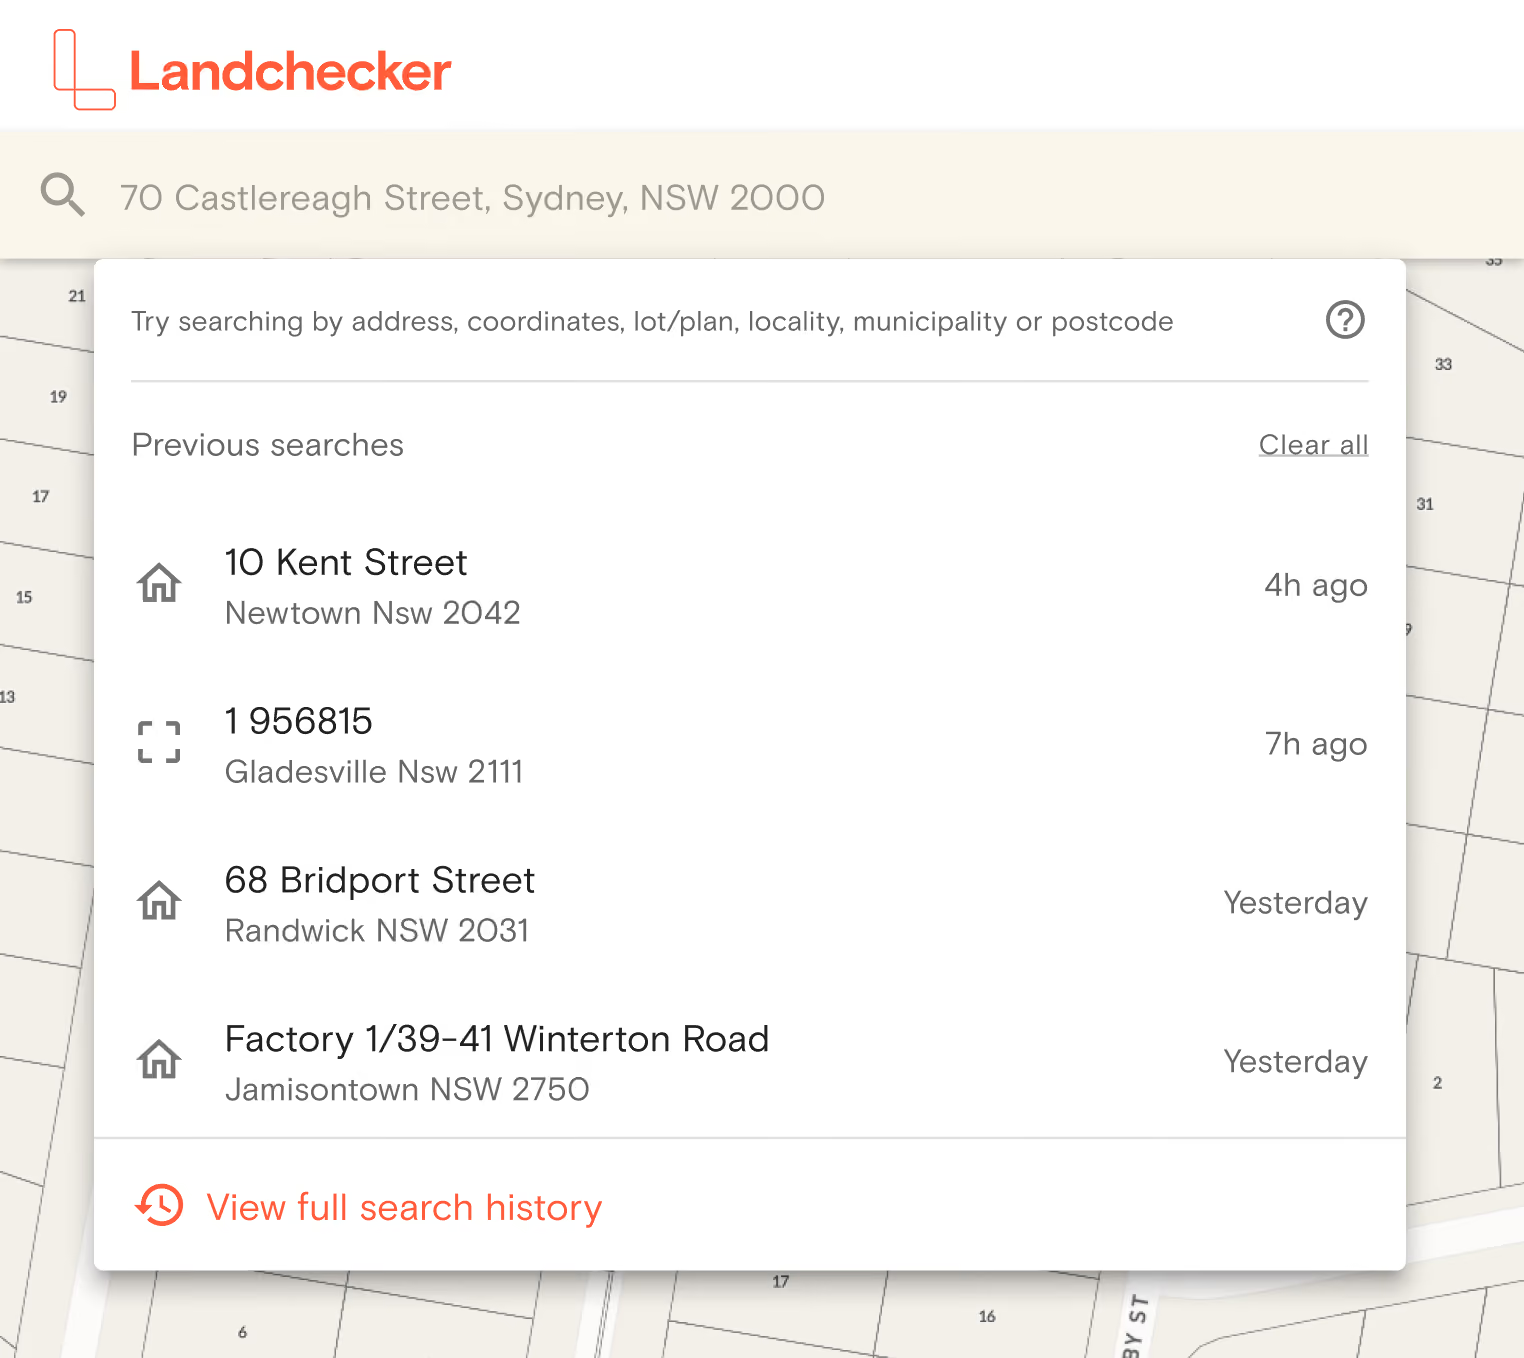
Landchecker search interface with recent property searches listed including addresses in Newtown, Gladesville, Randwick, and Jamisontown, NSW with timestamps from 4 hours to yesterday.

NSW Planning Controls and Zoning

Planning in NSW is set by each council's Local Environmental Plan (LEP), built on the Standard Instrument. Zone, height of building, floor space ratio and minimum lot size are separate LEP maps, and checking them one at a time is slow and easy to get wrong. We put all four on the same parcel, so you can see what a site permits in one pass.

For any NSW property you can view:
Get Started
Zone code and full zone name
The Standard Instrument zone code with its full name, such as R2 Low Density Residential or MU1 Mixed Use, as set by the council's LEP
Full scheme document
See the Local Environmental Plan and Development Control Plan that applies to the site, so you can read zone objectives and permitted uses at the source
Planning controls
Height of building, minimum lot size and floor space ratio for the parcel, read together from the current LEP maps
Layer opacity control
So zones, overlays, hazards and easements stay readable with several active at once
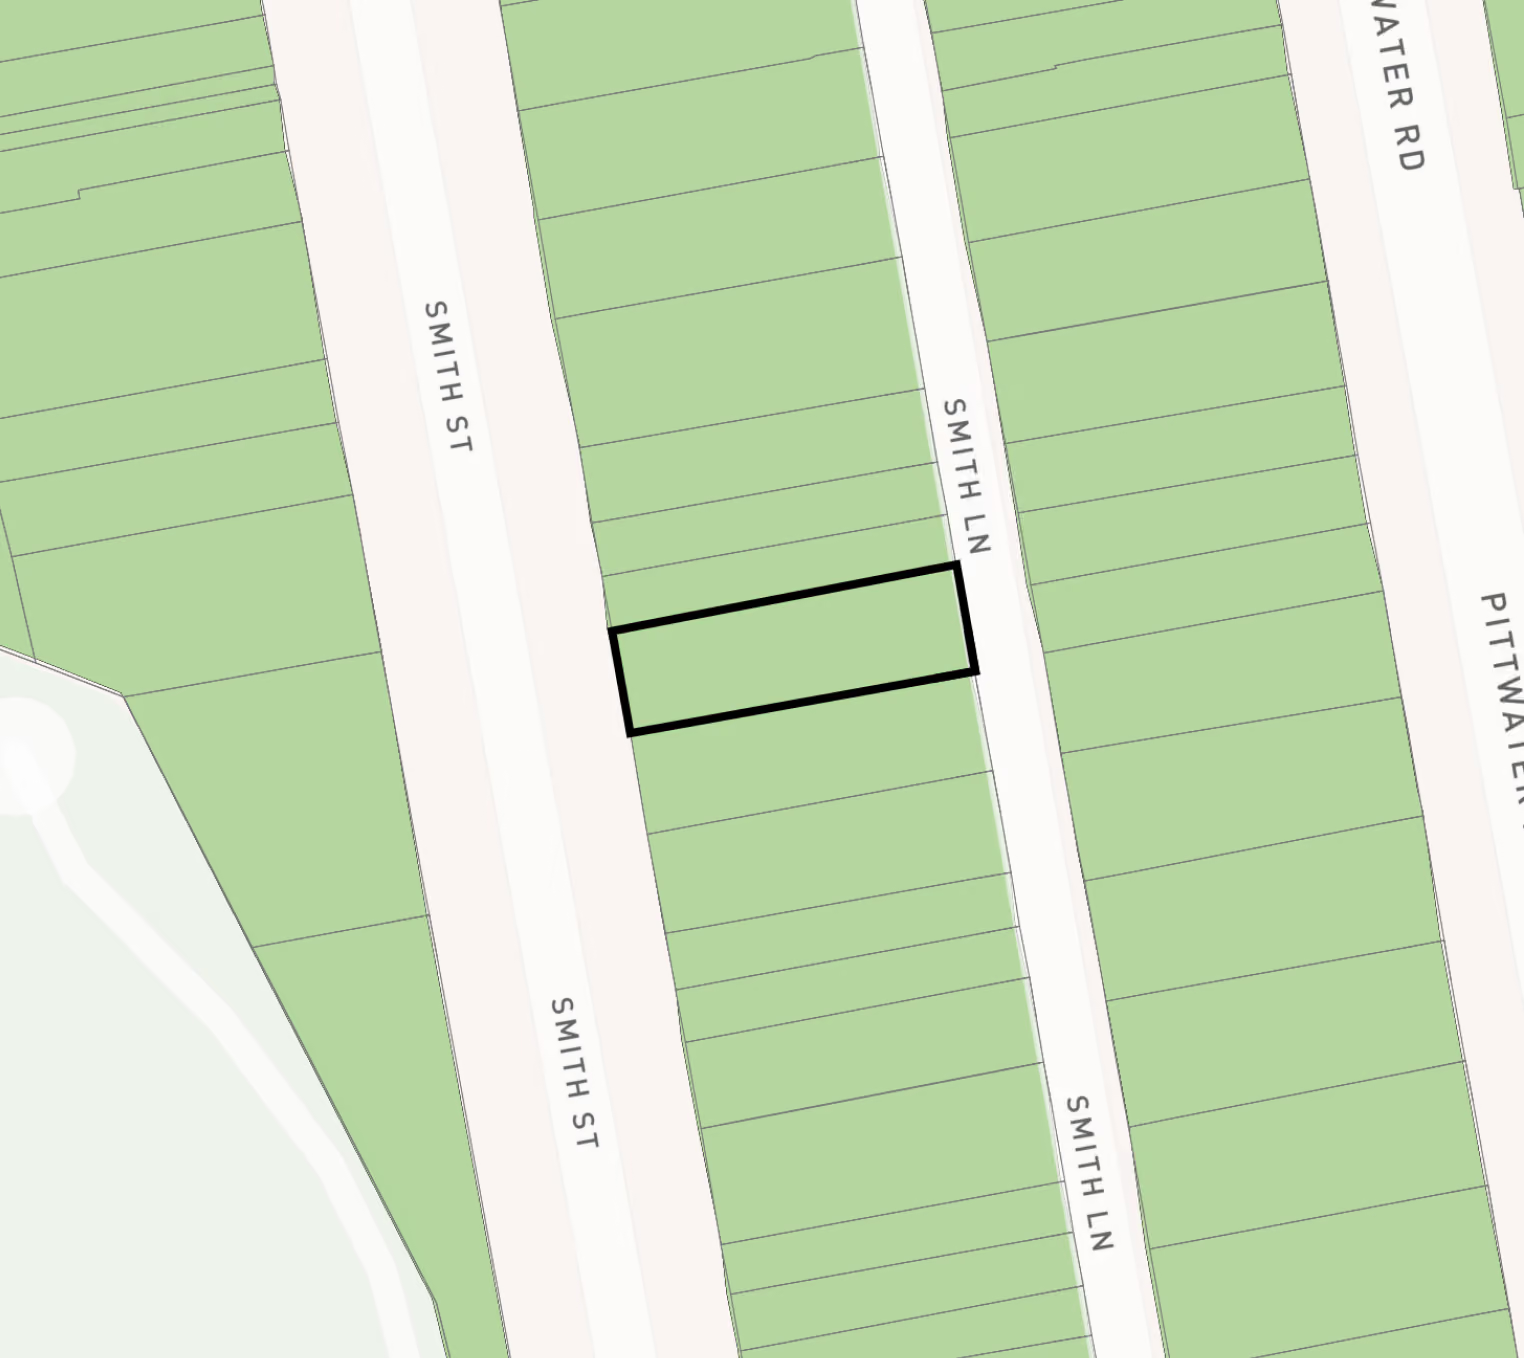
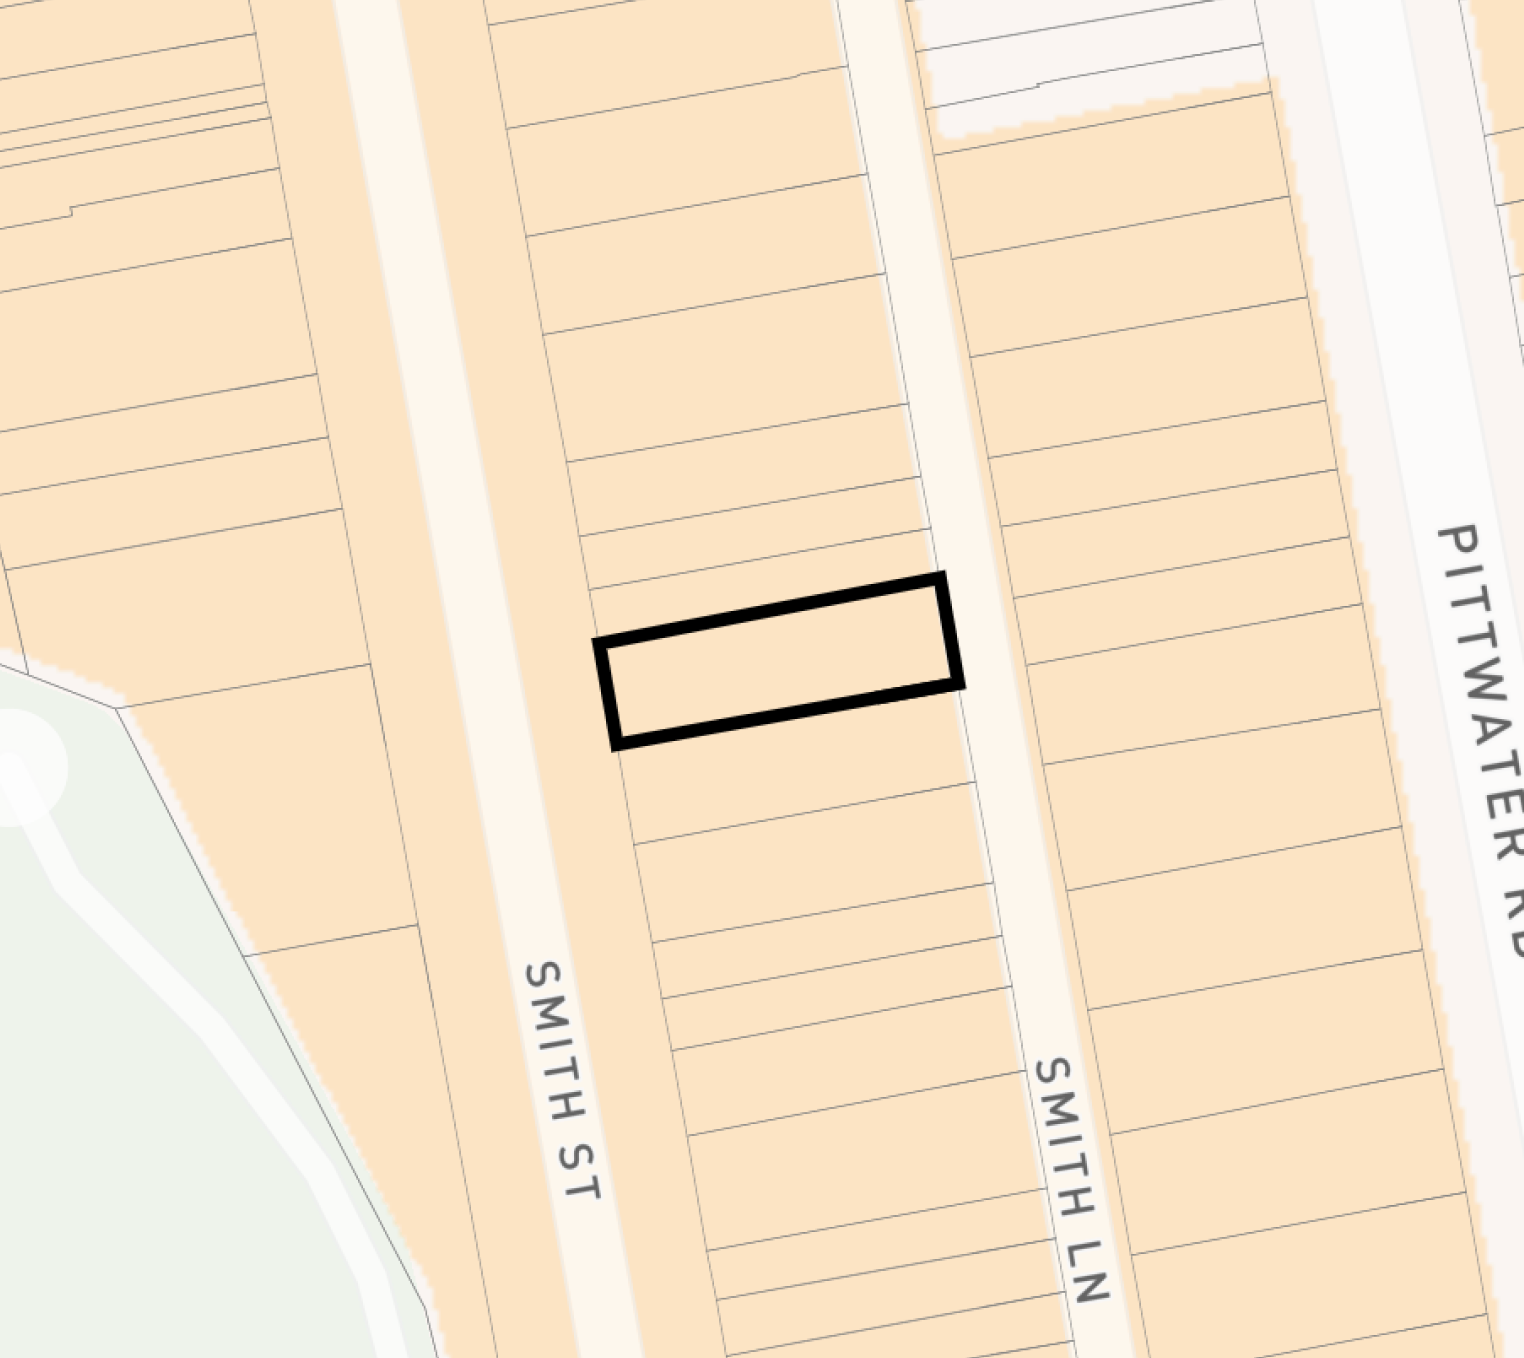
Map section showing rectangular land parcels between Smith Street and Smith Lane, with one parcel outlined in black. Pittwater Road is visible to the right, and a green area is partially visible on the left side of the map.
Low and Mid-Rise Housing
State policy now allows more housing types near train stations and town centres than many LEPs do on their own. Two sites a block apart can both sit in a Low and Mid-Rise Housing area and face very different development potential.

Turn on the Low and Mid-Rise Housing layer and the map shows which classification applies:
  • LMR Centre
  • Transport Oriented Development (TOD)
  • TOD Accelerated Rezoning Area
  • Indicative LMR Housing Area
Map section showing a rectangular plot outlined in black between Smith Street on the left and Smith Lane on the right, with multiple similar green plots aligned vertically on both sides.
Height of Building
The Height of Building control sets the maximum height, in metres, permitted on a parcel under the relevant environmental planning instrument. It's the fastest read on how many storeys a site can realistically carry — a 9-metre limit is broadly two storeys, while 21 metres opens up six or seven.

Because heights are set by individual LEPs and amended regularly, the figure on a site today may not be the figure from last year. Landchecker maps the current control so you're not working from a saved PDF of a council map.
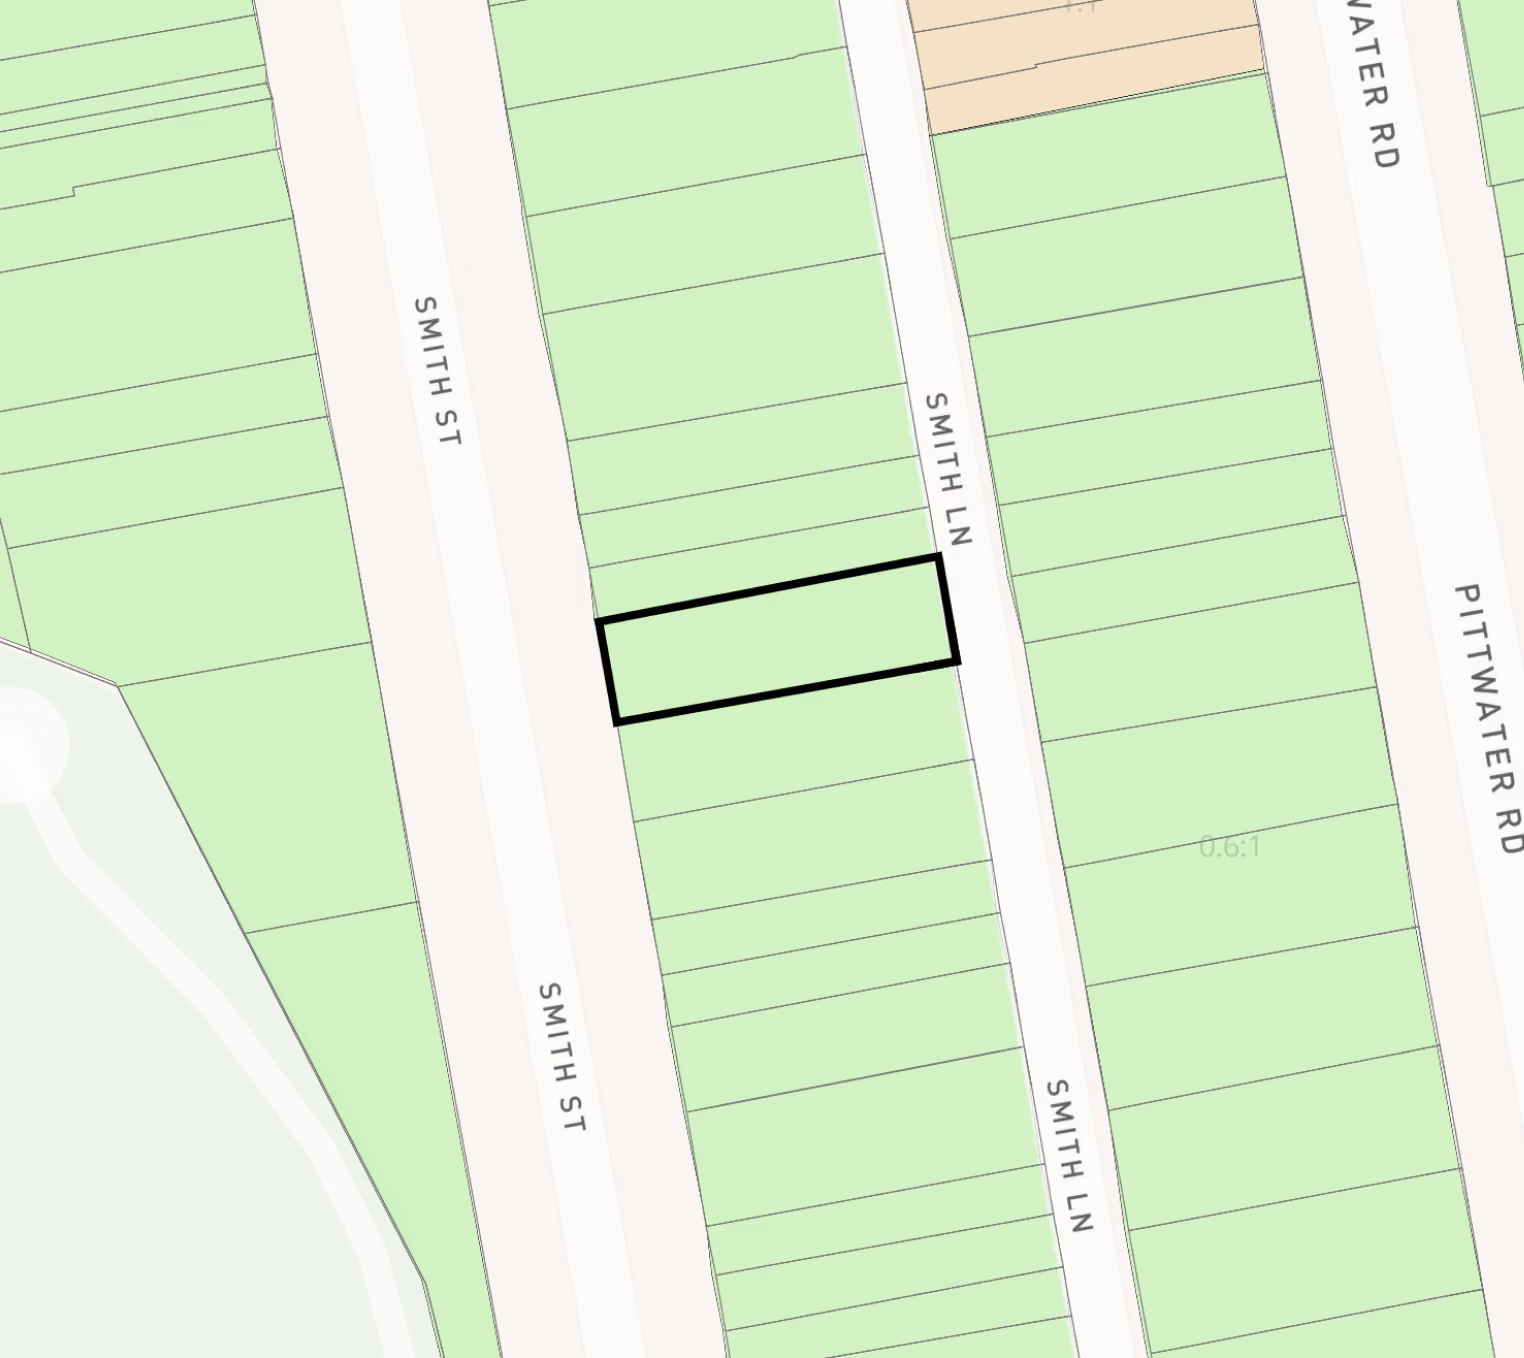
Map showing a rectangular plot outlined in black located between Smith Street and Smith Lane, with Pittwater Road to the east and a green area to the west.
Floor Space Ratio
Floor Space Ratio sets the maximum gross floor area permitted relative to the site area, expressed as a ratio such as 0.5:1 or 3:1. Where height governs the shape of a building, FSR governs its bulk — and in practice FSR is usually the control that determines yield.

The arithmetic is straightforward once you have the number. A 700 m² site with an FSR of 0.5:1 permits 350 m² of gross floor area. The same site at 2:1 permits 1,400 m². Read alongside the height control and the zone, FSR is what turns a site into a feasibility.
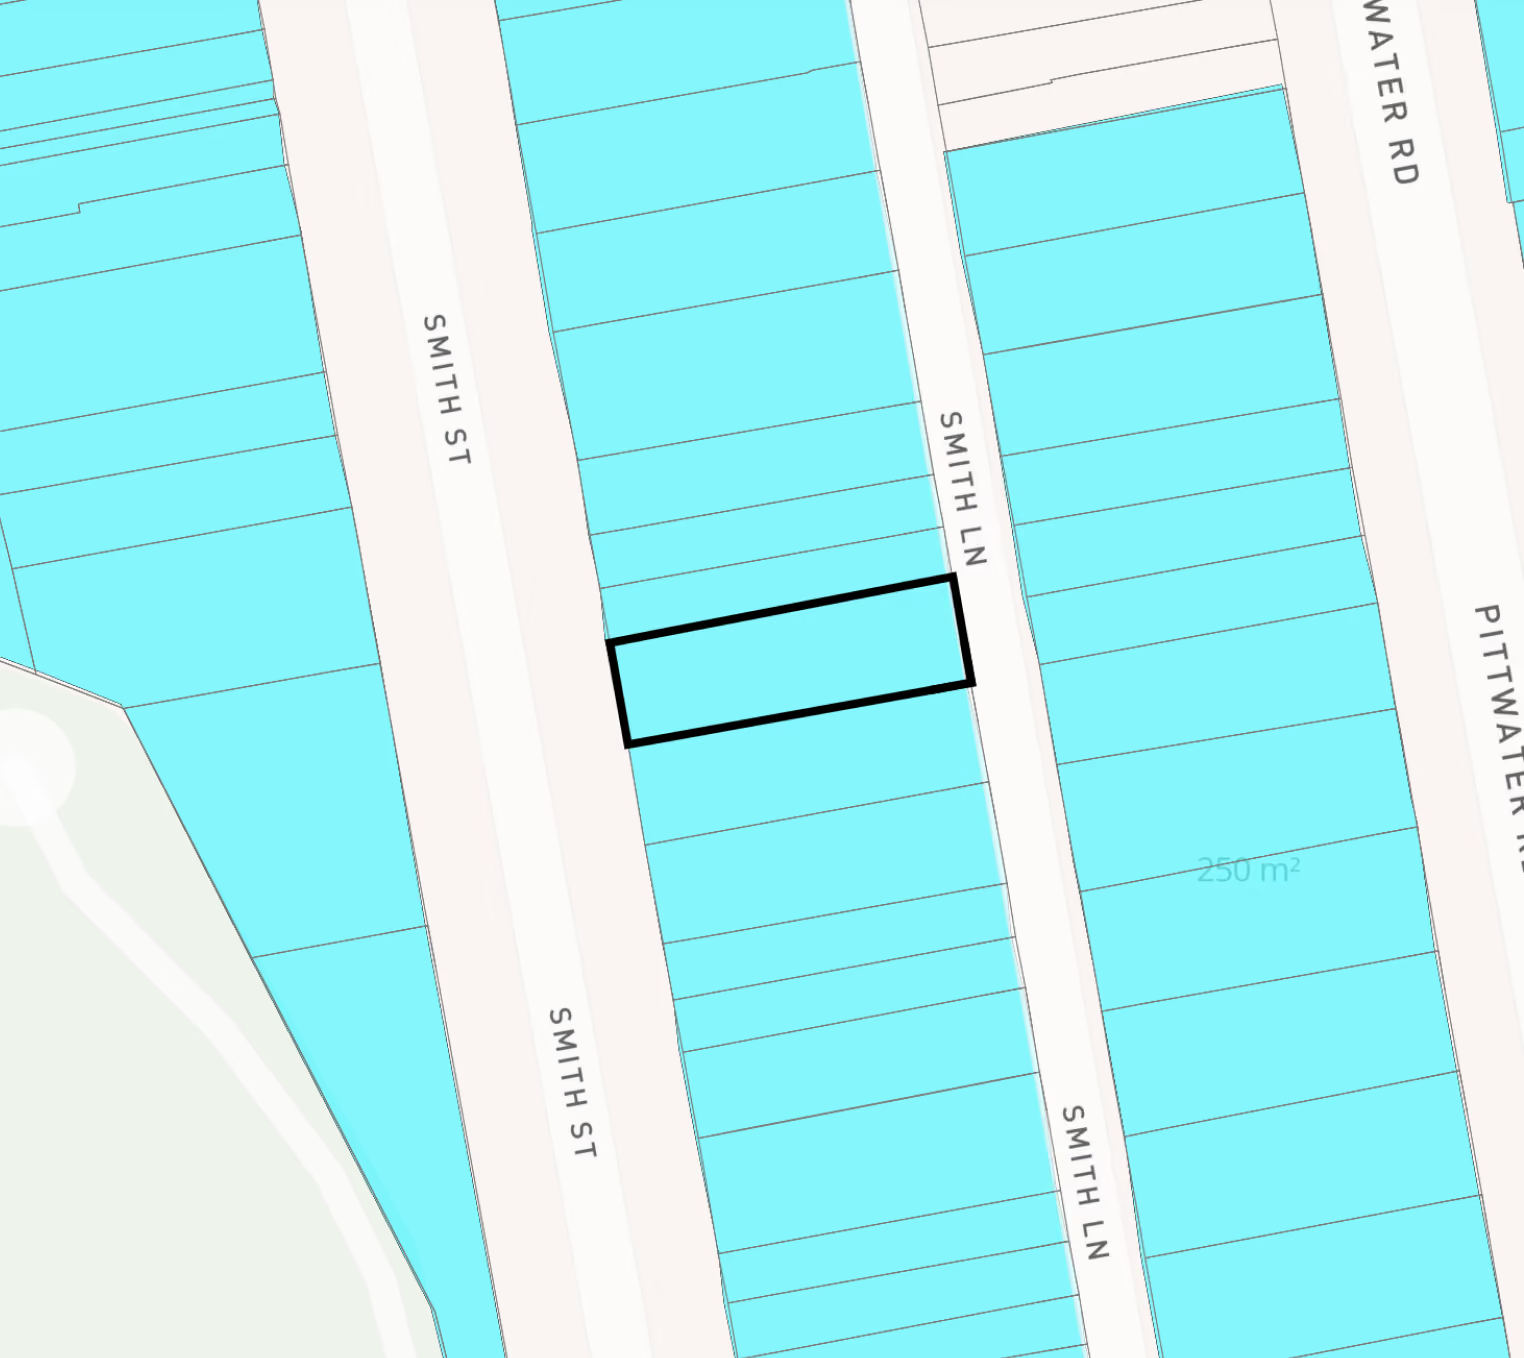
Map section showing properties on Smith Street and Smith Lane, with a single rectangular property outlined in black along Smith Lane in a predominantly blue area indicating plots.
Minimum Lot Size
Minimum Lot Size sets the smallest parcel that can be created on subdivision, expressed in square metres or hectares depending on the location. It's the first check for anyone considering a subdivision or dual occupancy, and the quickest way to rule a site in or out — a 900 m² parcel in an area with a 450 m² minimum is a candidate; the same parcel where the minimum is 550 m² isn't.

Minimum lot size also interacts with other controls in ways that aren't always obvious, which is why reading it in isolation can be misleading.
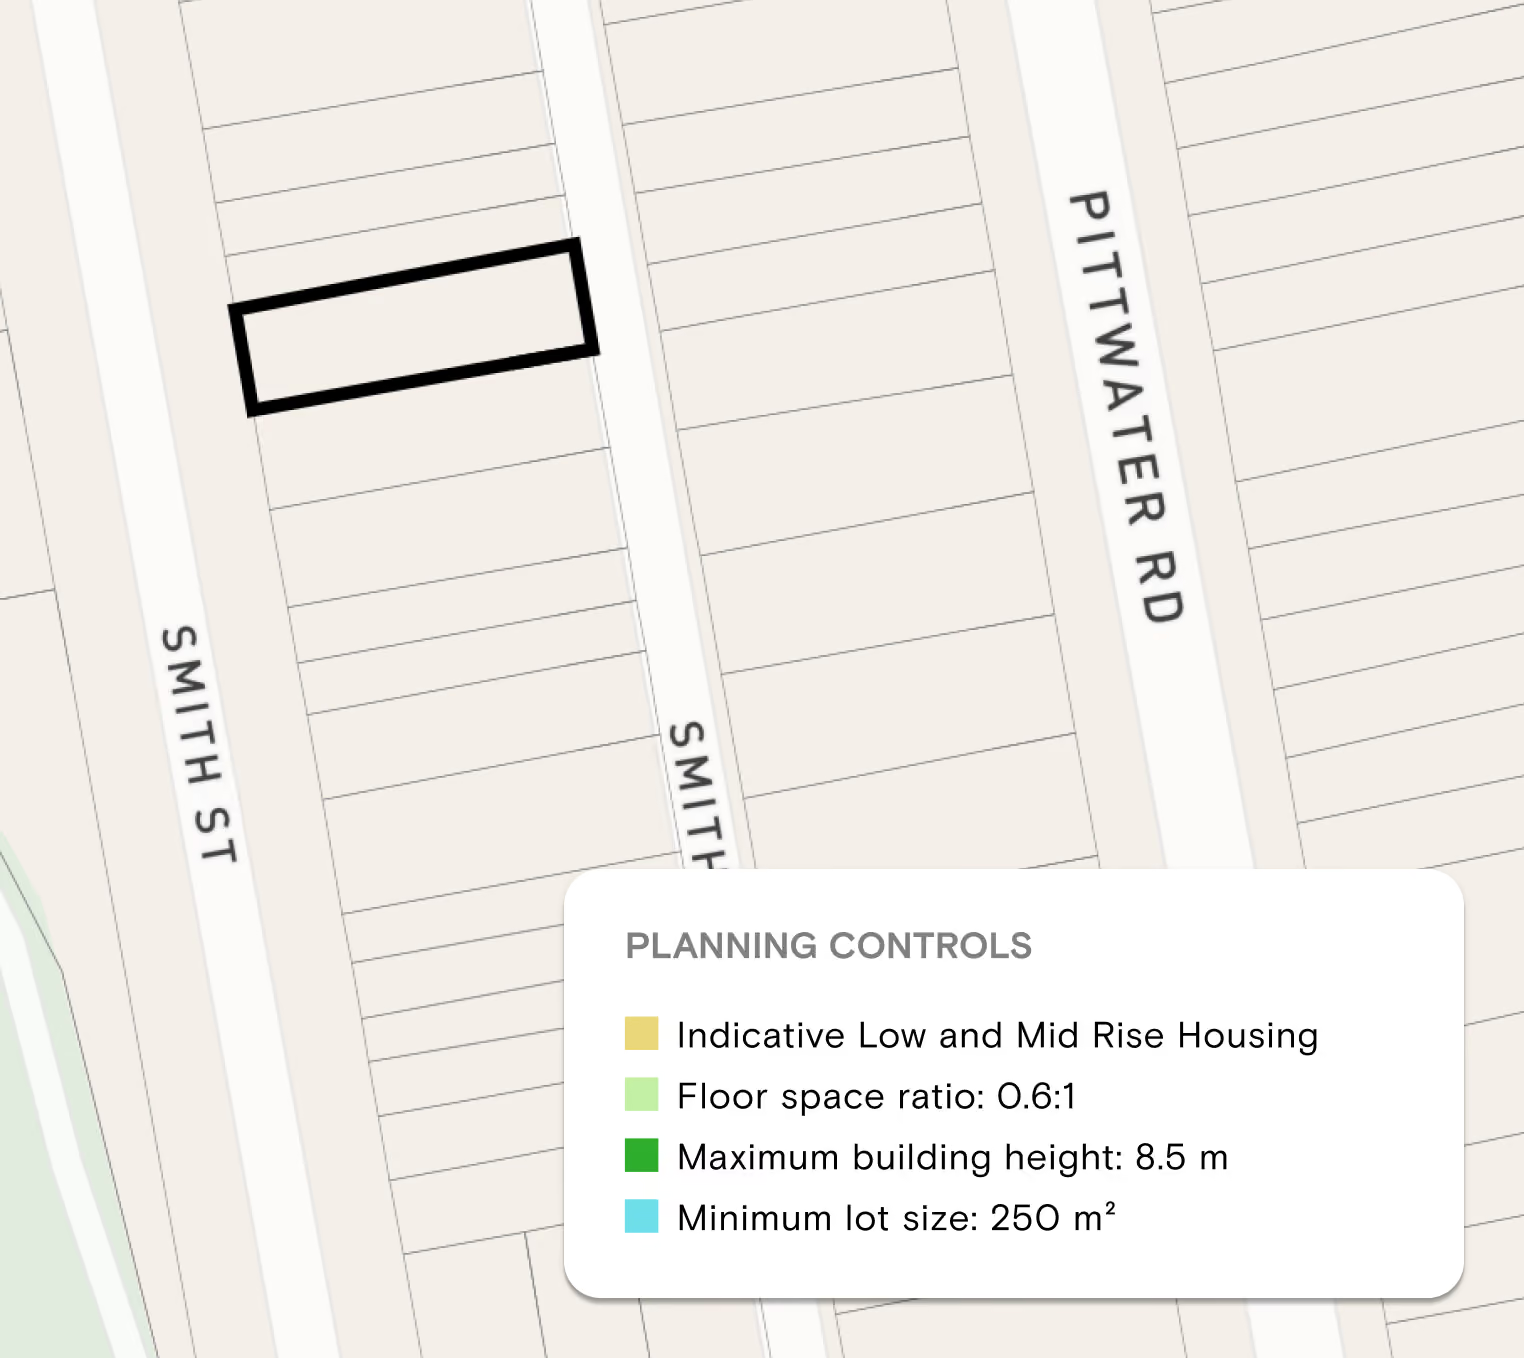
Map segment showing property lots between Smith St, Smith St, and Pittwater Rd with one lot outlined in black. A legend for planning controls indicates yellow for low and mid-rise housing, light green for floor space ratio 0.6:1, dark green for maximum building height 8.5 meters, and blue for minimum lot size 250 square meters.
Reading the Controls Together
Zone, height, FSR and minimum lot size are four separate maps published by the Department of Planning, Housing and Infrastructure, and checking them one at a time across separate viewers is slow and error-prone. Landchecker puts them on the one map against the one parcel, so you can see the full picture of what a site permits in a single pass — then layer on hazards, aerial imagery and nearby DA activity without leaving the screen.

Flood, Bushfire and Other Hazard Data

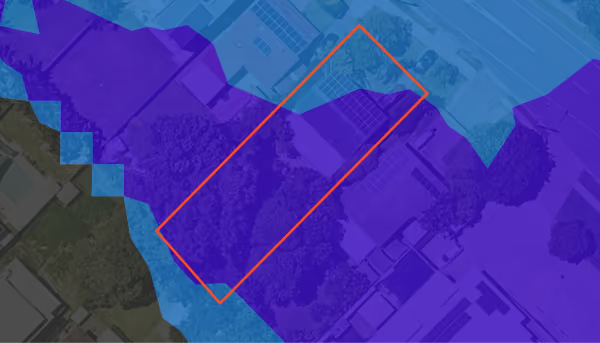
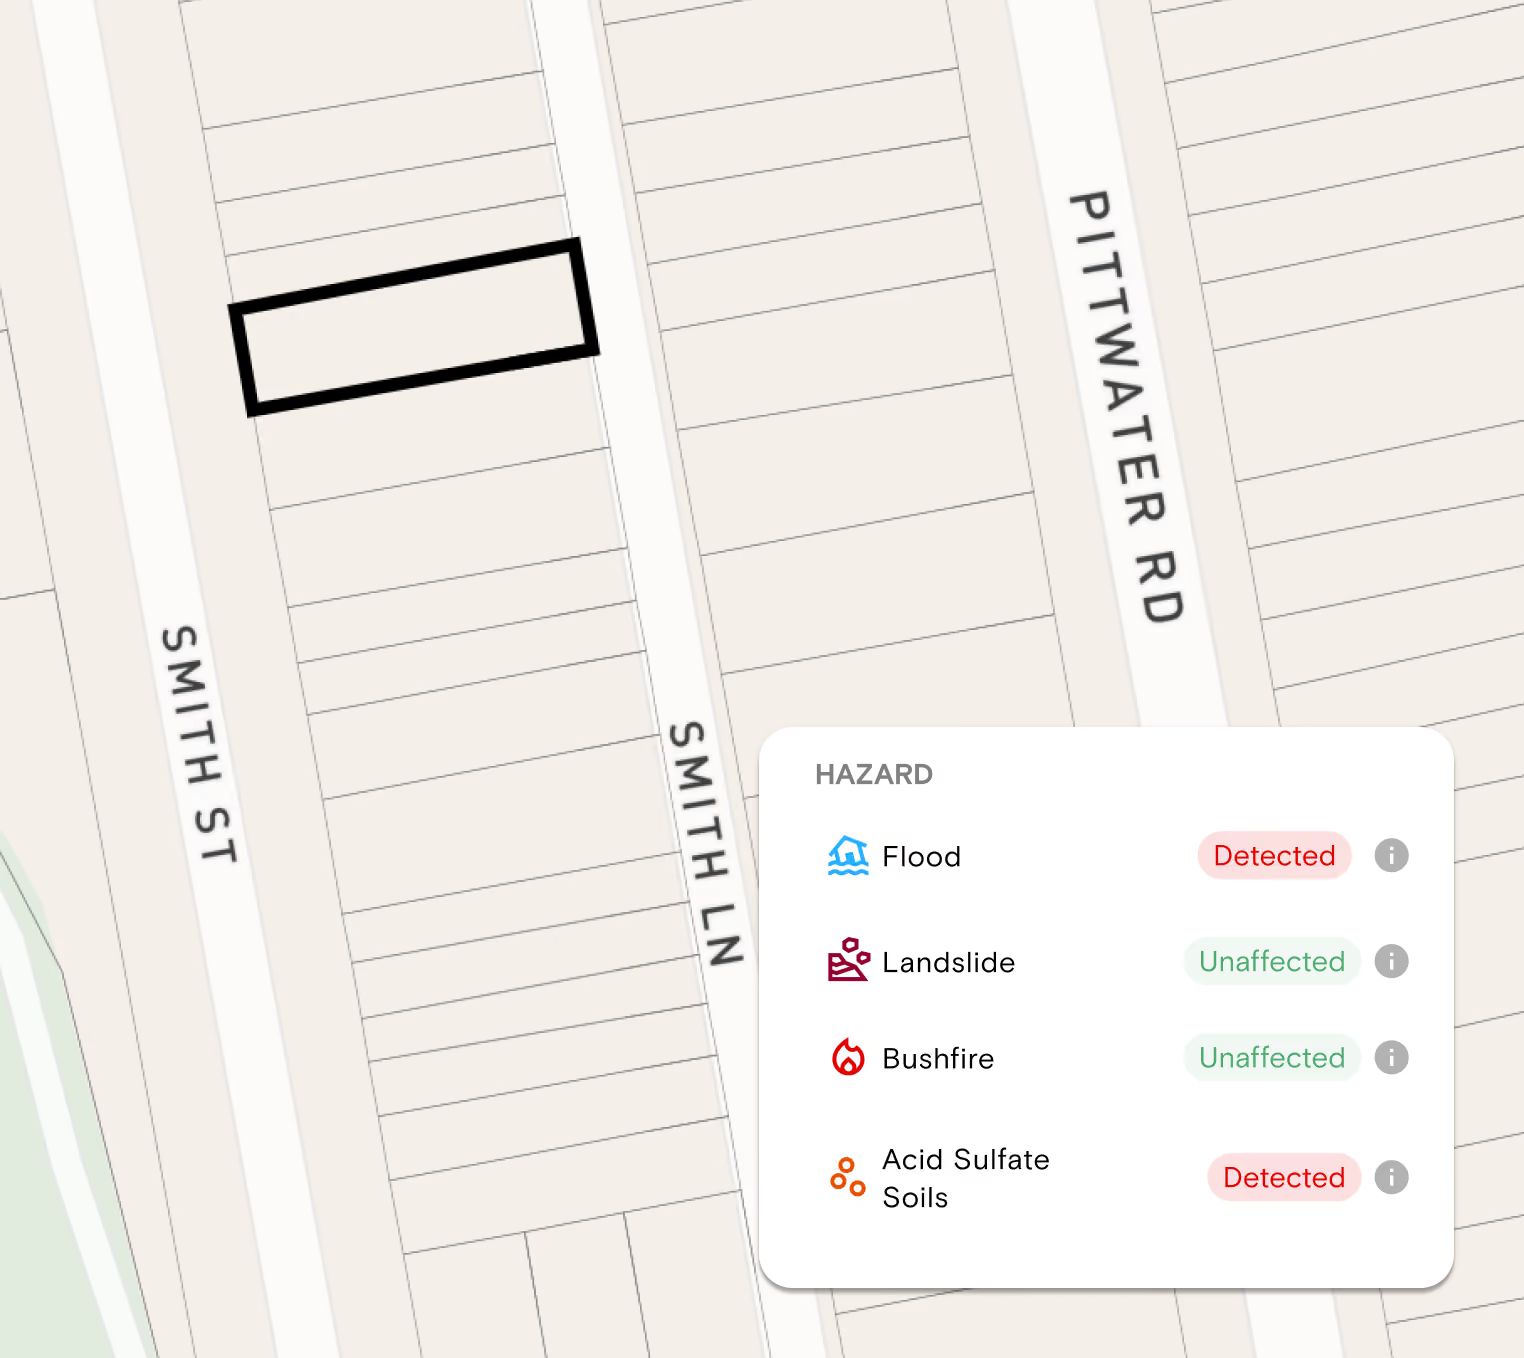
NSW hazard data sits with councils, state agencies and separate LEP maps. We put five hazard layers on the same parcel as your planning controls, so you can check a site's constraints in the same pass as its development potential.
  • Flood — We combine the DPHI EPI flood layer with council flood data where it's published.
  • Bushfire prone land — Shows whether a site is mapped as bushfire prone, which affects how a new home has to be built.
  • Landslide — Shows land mapped as at risk of landslide or slope instability, an early flag for geotechnical reports and higher construction costs.
  • Acid sulfate soils — Shows the acid sulfate soils class mapped in the council's LEP. Works below a certain depth in these areas can need consent and a management plan, which matters for basements and excavation.
  • Mine subsidence — Shows whether a property sits in a mine subsidence district, where building needs Subsidence Advisory NSW approval.
Hazard layers flag where to look closer. They don't replace a certificate or specialist report.
Map segment showing a property outlined in black between Smith Street and Smith Lane near Pittwater Road, with a hazard legend indicating flood and acid sulfate soils detected, while landslide and bushfire hazards are unaffected.
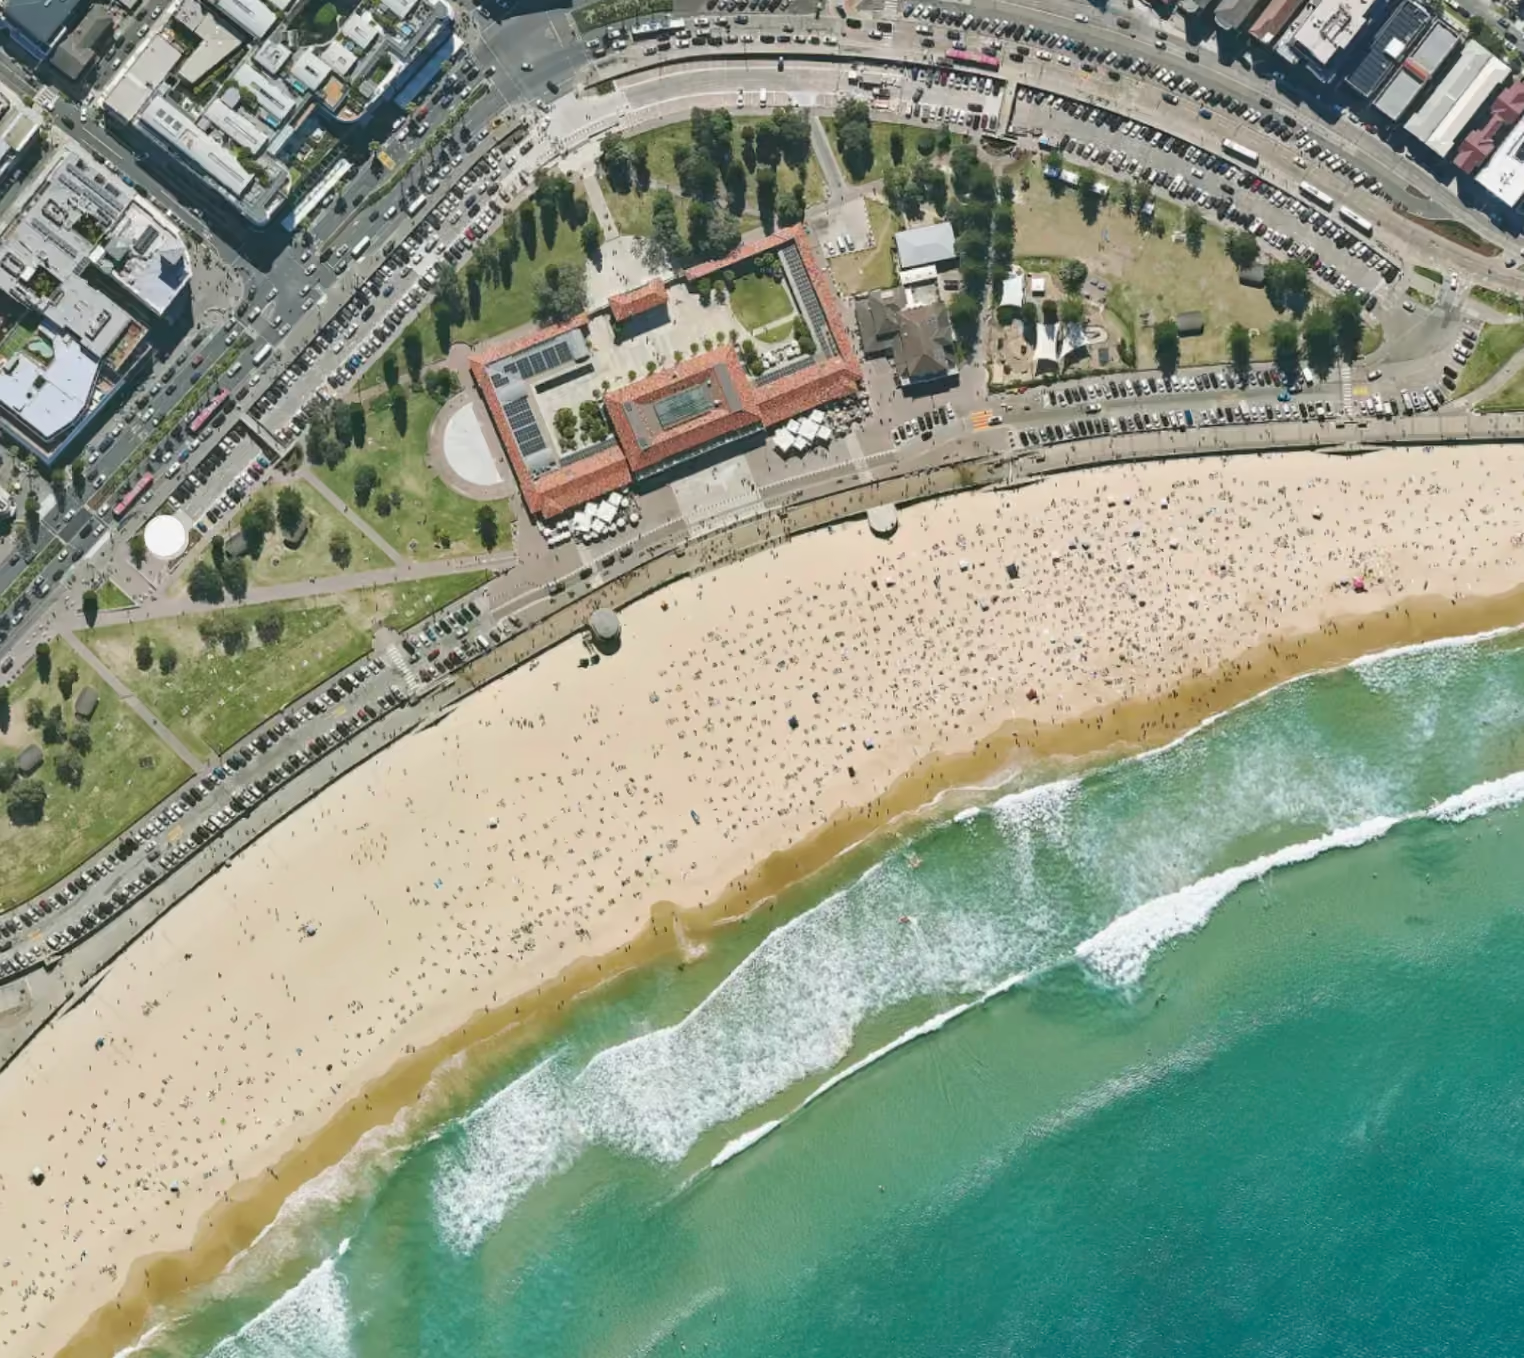
Aerial view of a curved sandy beach with many people scattered on it, adjacent to turquoise ocean waves; behind the beach is a promenade with several buildings, green lawns with trees, parking lots, and city streets.

Aerial Imagery at Six Times the Resolution of Satellite

See every detail of any New South Wales property with quarterly-updated aerial imagery at six times higher resolution than satellite. That’s enough to pick out rooflines, fence lines, pools, vegetation and site access.

Because the imagery is captured on a regular cycle and archived, you can:
  • Scroll back through the archive to see how a property has changed over time before a valuation, a listing or a due diligence report

    Compare two capture dates side by side to see when a structure went up, a shed came down or vegetation was cleared
  • Imagery is refreshed three to four times a year across Sydney and other metro areas, and once or twice a year in key regional areas
  • Export high-resolution imagery to drop into reports, board papers and client presentations
  • Unlimited on every paid plan
Learn more about high-resolution aerial imagery

Development Applications in NSW

Understanding what a council has approved nearby is often the fastest way to read development potential.

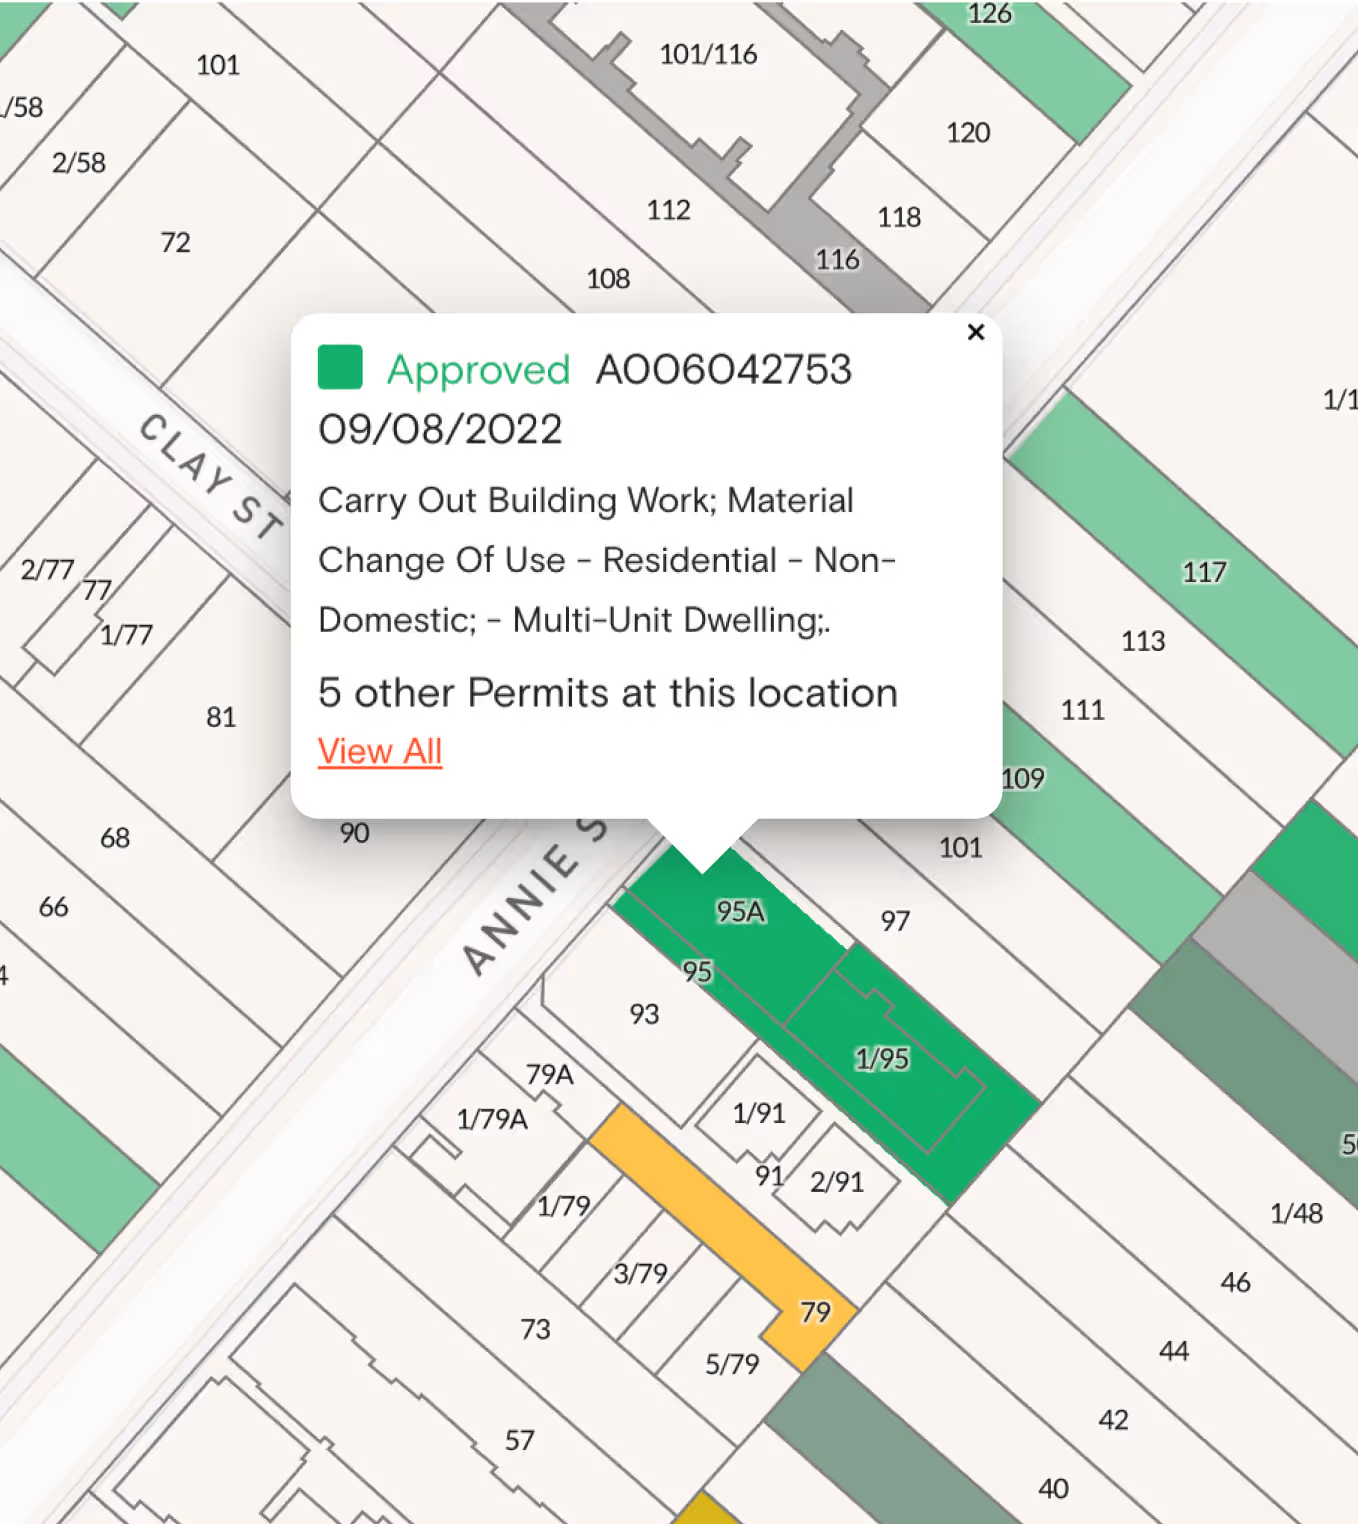
Landchecker lets you check approved, pending and rejected development applications (DAs) in the vicinity of your subject property, filter them by the criteria that matter to you, and set alerts so new applications come to you rather than the other way around. It's a practical way to build a picture of what's realistic in a given street before you commit time to a feasibility.
State Significant Development (SSD) Applications
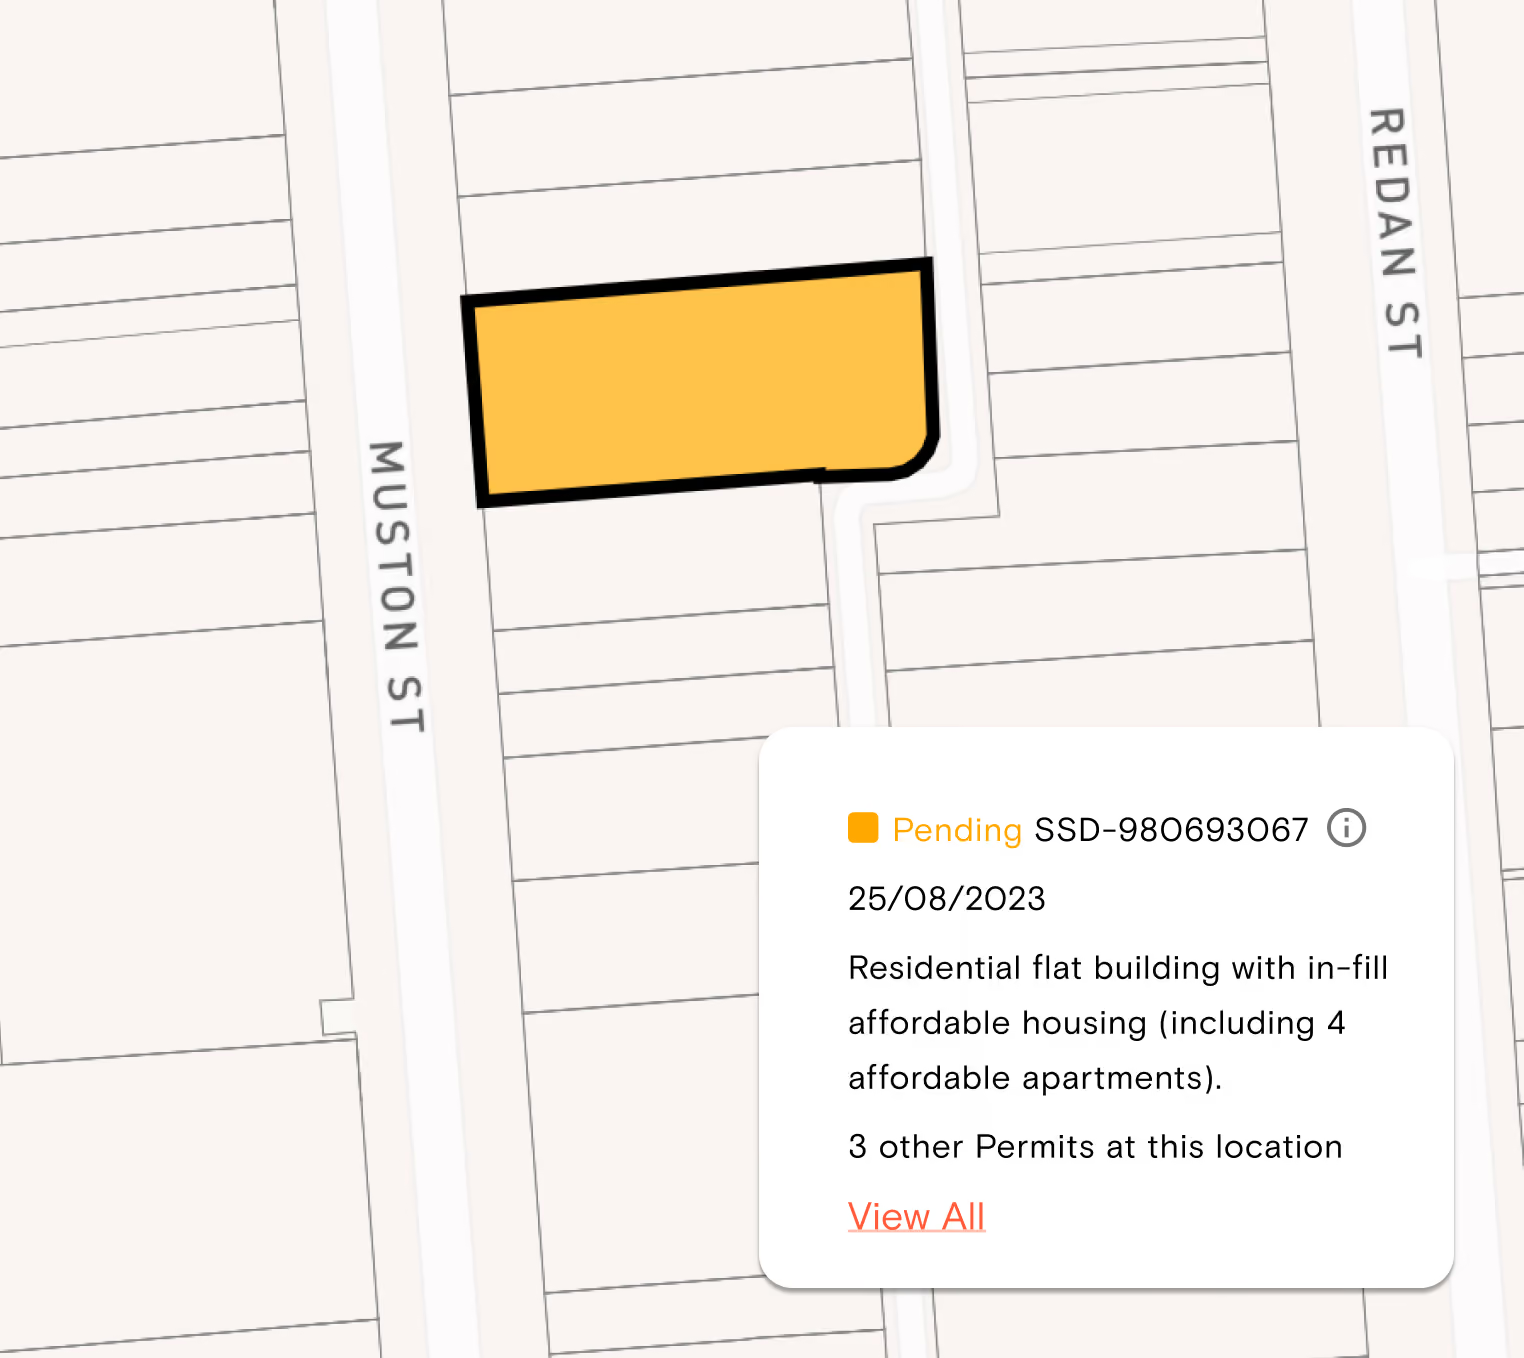
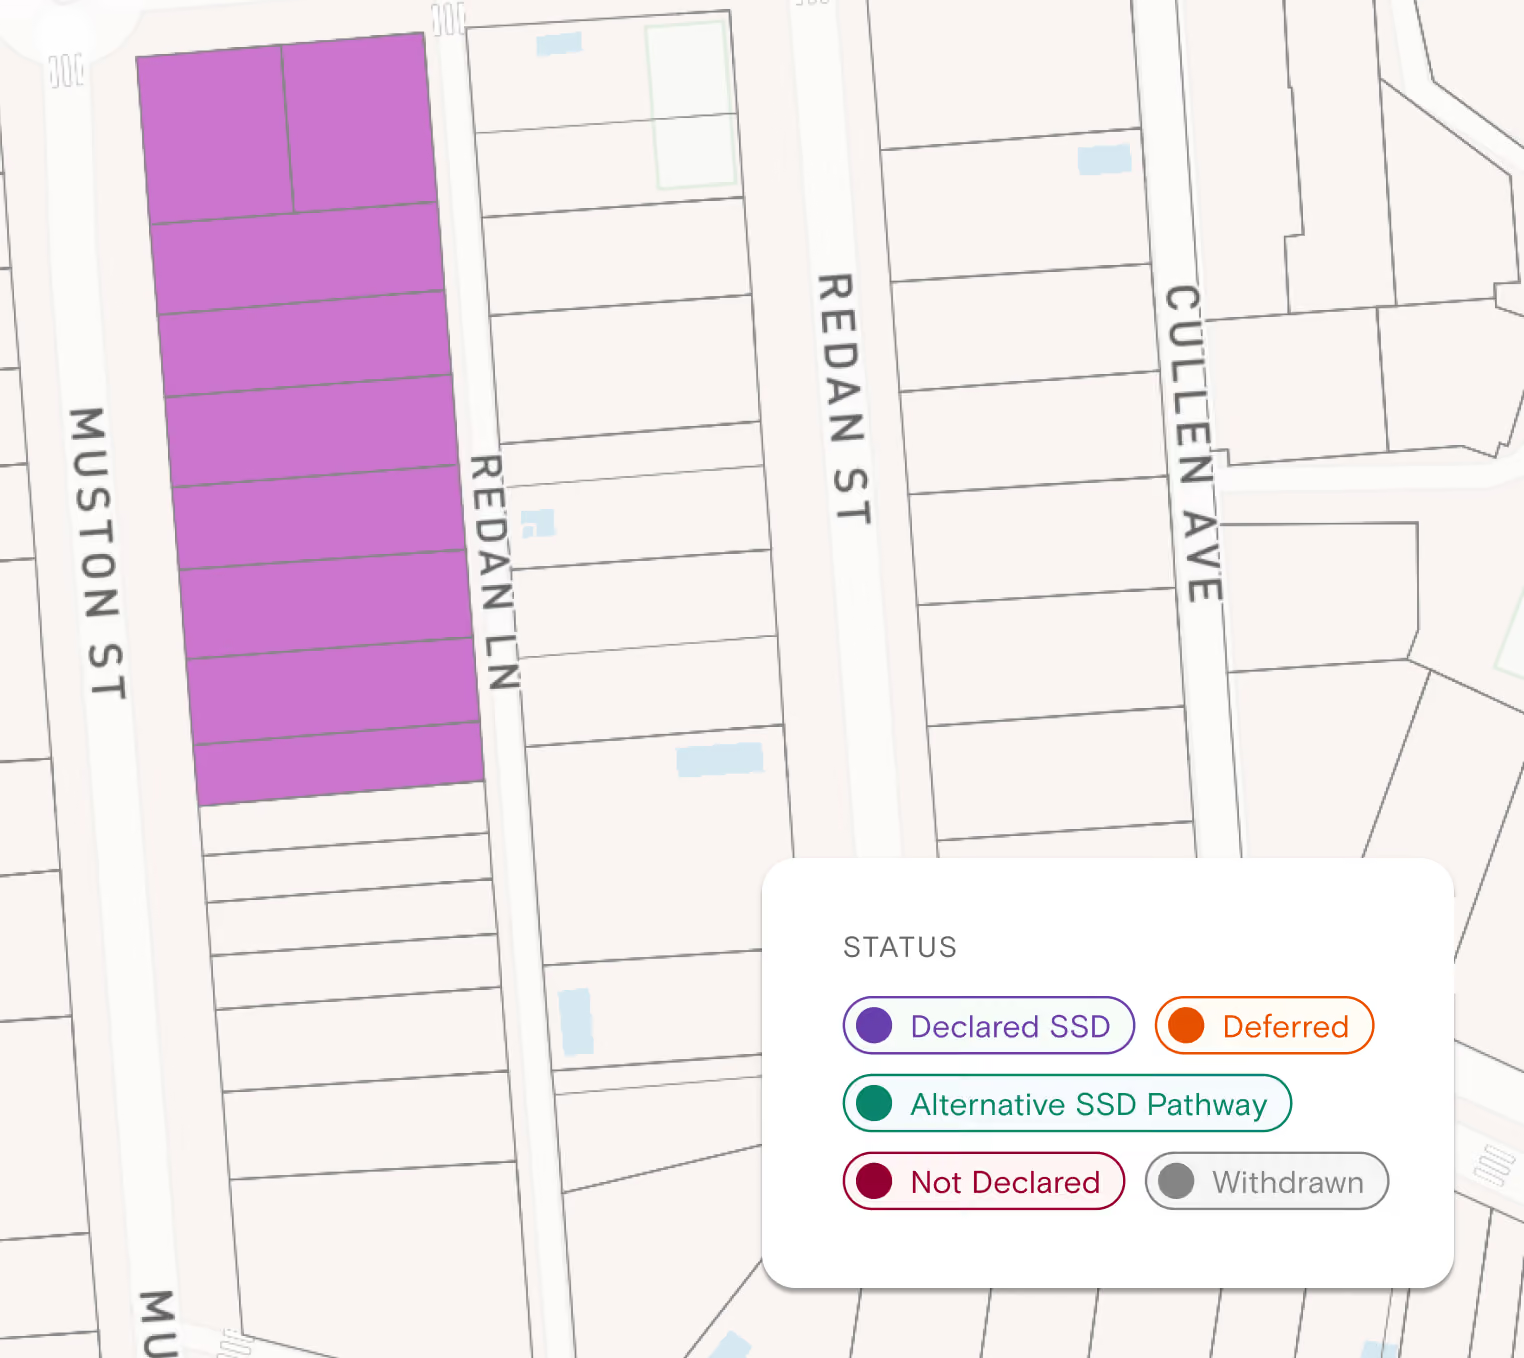
The largest NSW projects are assessed by the state, not the council, so they won't appear in a council DA register. We show proposed, approved and refused SSD applications on the map alongside council DAs, so the biggest projects in an area aren't missed.
Map showing a highlighted rectangular property lot at the corner of Muston St and another unnamed street, marked Pending SSD-980693067 with details of a residential flat building including 4 affordable apartments and three other permits at this location.
Map showing a block of properties highlighted in purple along Muston Street and Redan Lane, indicating a Declared SSD status; a legend on the map shows status colors: Declared SSD in purple, Deferred in orange, Alternative SSD Pathway in teal, Not Declared in dark red, and Withdrawn in grey.
Housing Delivery Authority (HDA) Pathway
The Housing Delivery Authority, set up in December 2024, is the NSW Government's fast-track for major housing. It recommends which large residential proposals should be declared State Significant, and some can proceed with a concurrent rezoning. That means a site's current zoning may not tell you everything about what's coming to the street.

For anyone working in NSW residential development, that pipeline is now essential context:
  • Developers and town planners can see which nearby sites have been declared SSD, and what the HDA has been prepared to recommend — useful precedent when weighing up an EOI of your own
  • Valuers and agents get early visibility of high-yield supply that hasn't reached a council DA register
  • Conveyancers and buyers' advocates can check whether a site or its neighbours sit inside a fast-tracked pathway that may change the density and character of a street
  • Anyone assembling a site can cross-reference HDA activity against zoning, Low and Mid-Rise Housing areas and transport-oriented development controls on the same map
Because HDA proposals can override some local controls, a site's current zoning no longer tells you the whole story. Reading the state pathway alongside the local one is the only way to get an accurate picture.
Learn more about Permits & DAs

Sales History and Suburb Insight

For anyone pricing, valuing or prospecting in NSW, the market context sits alongside the planning context:
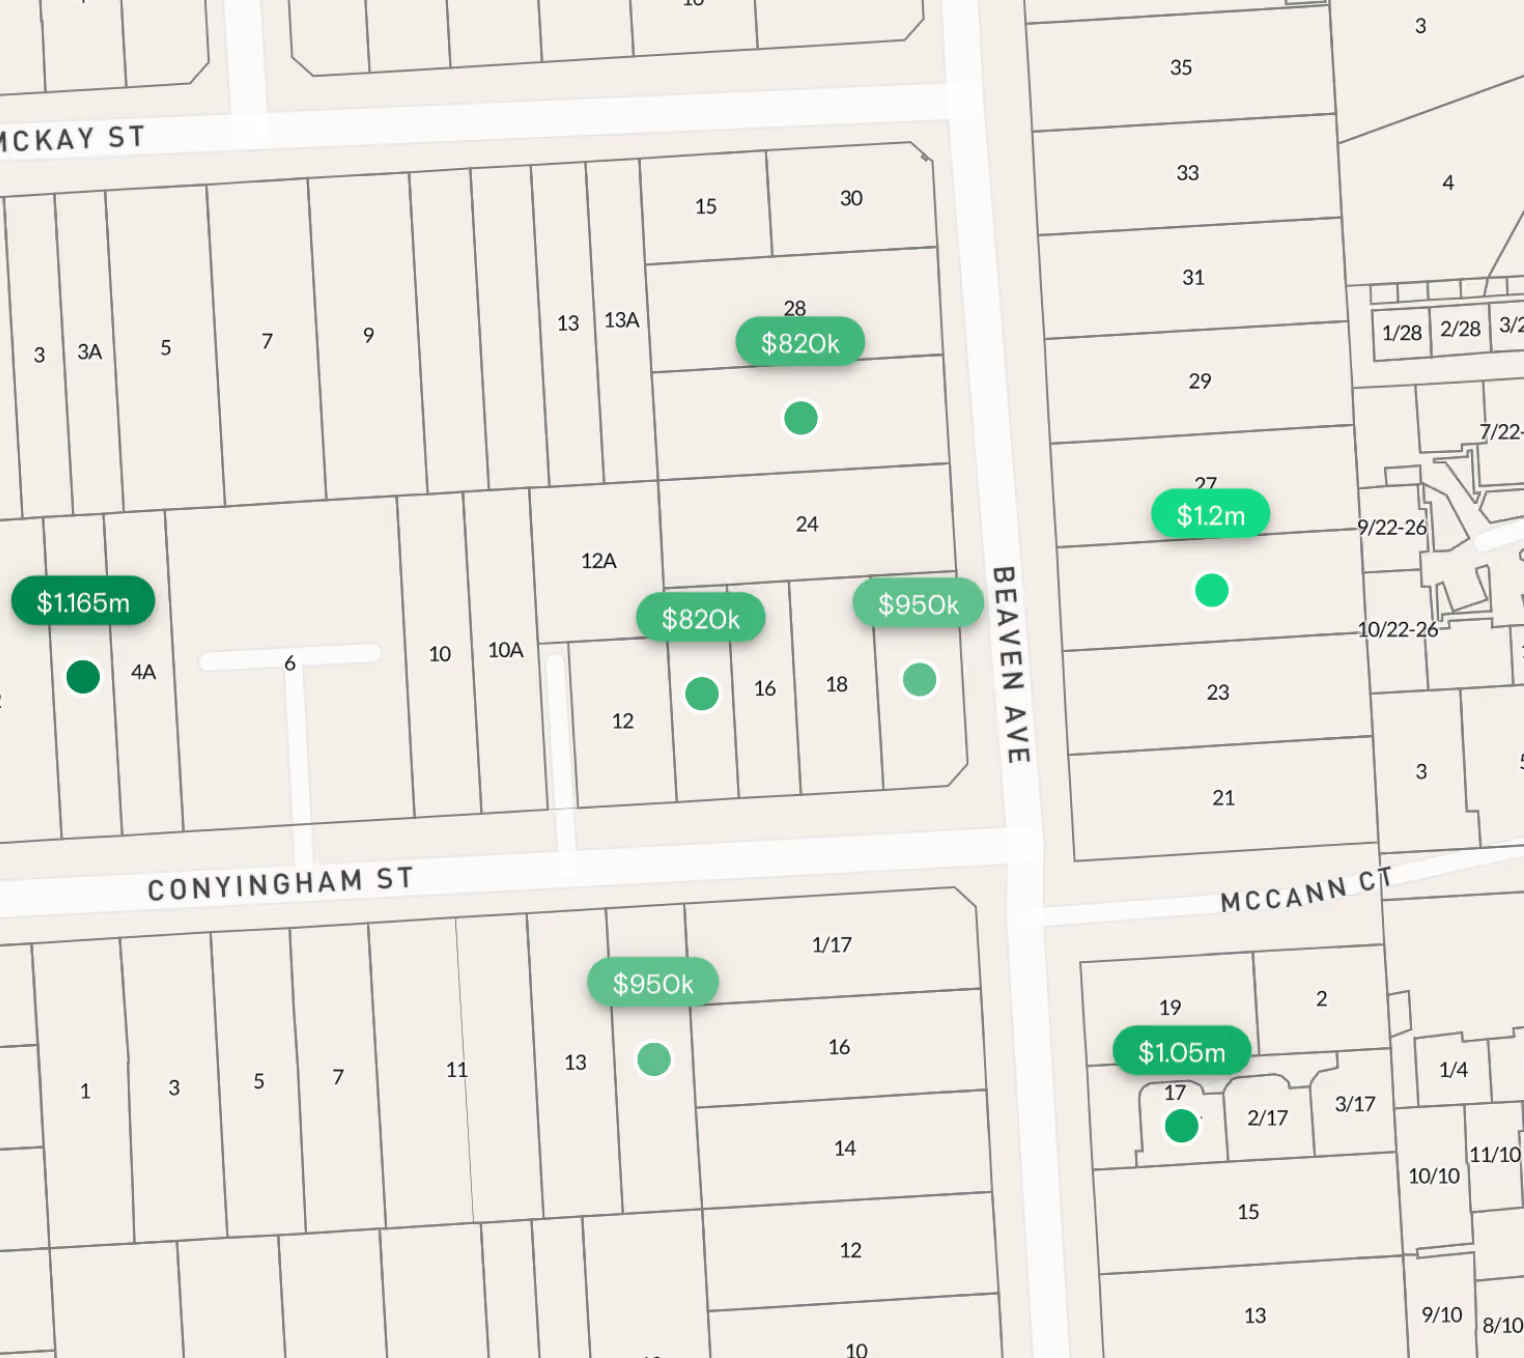
  • Property sales history for the subject site
  • Comparable sales in the surrounding area
  • Suburb profiles for a broader read on a market
  • Sale History Reports you can order as a standalone document when you need the record in writing
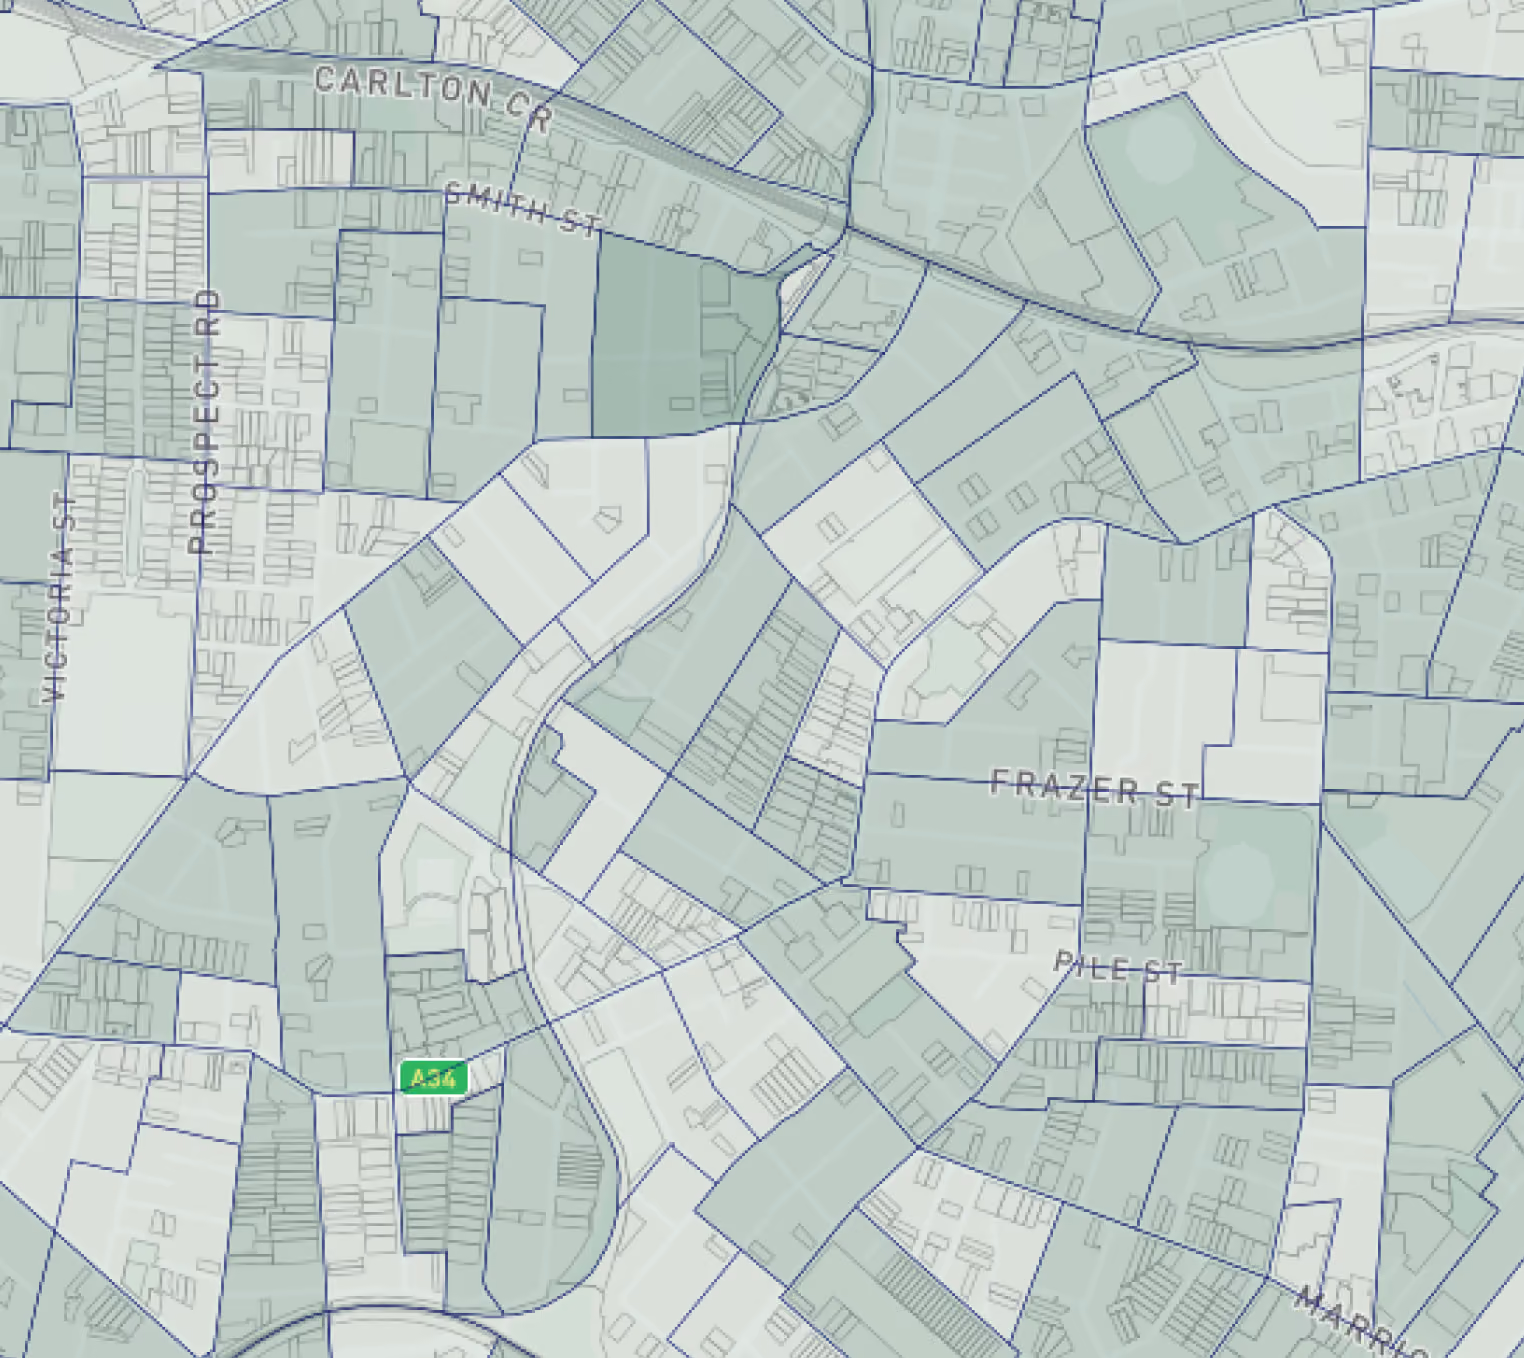
Map section showing a neighborhood with labeled streets including Carlton Cr, Smith St, Frazer St, Pile St, and Prospect Rd, with parcel boundaries outlined in blue and an A34 highway marker.

Property Documents Available in New South Wales

We're an information broker for NSW Land Registry Services. Order NSW documents directly from the map or from the document searches page, at competitive rates, with most searches fulfilled instantly.

Here's the full set available for New South Wales.

Get Started
NSW Land Title Search
The current title for a property, showing the registered owner, lot and plan, and any mortgages, caveats, easements or covenants recorded against it.
NSW Plans
The registered survey plan showing lot boundaries, dimensions and any easements created when the land was subdivided.
- Deposited plans (DP)
- Strata plans (SP)
- Community plans (CP)
NSW Dealings
Registered instruments that change or record an interest in the land, listed by dealing number on the title.
- Transfer
- Mortgage
- Discharge of mortgage
- Caveat
- Lease
Section 88B Instrument (88B Search)
The document lodged with a plan that sets out the terms of easements, restrictions on use and positive covenants affecting the lots.
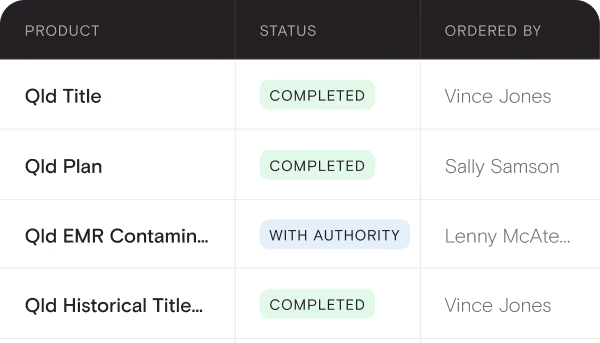
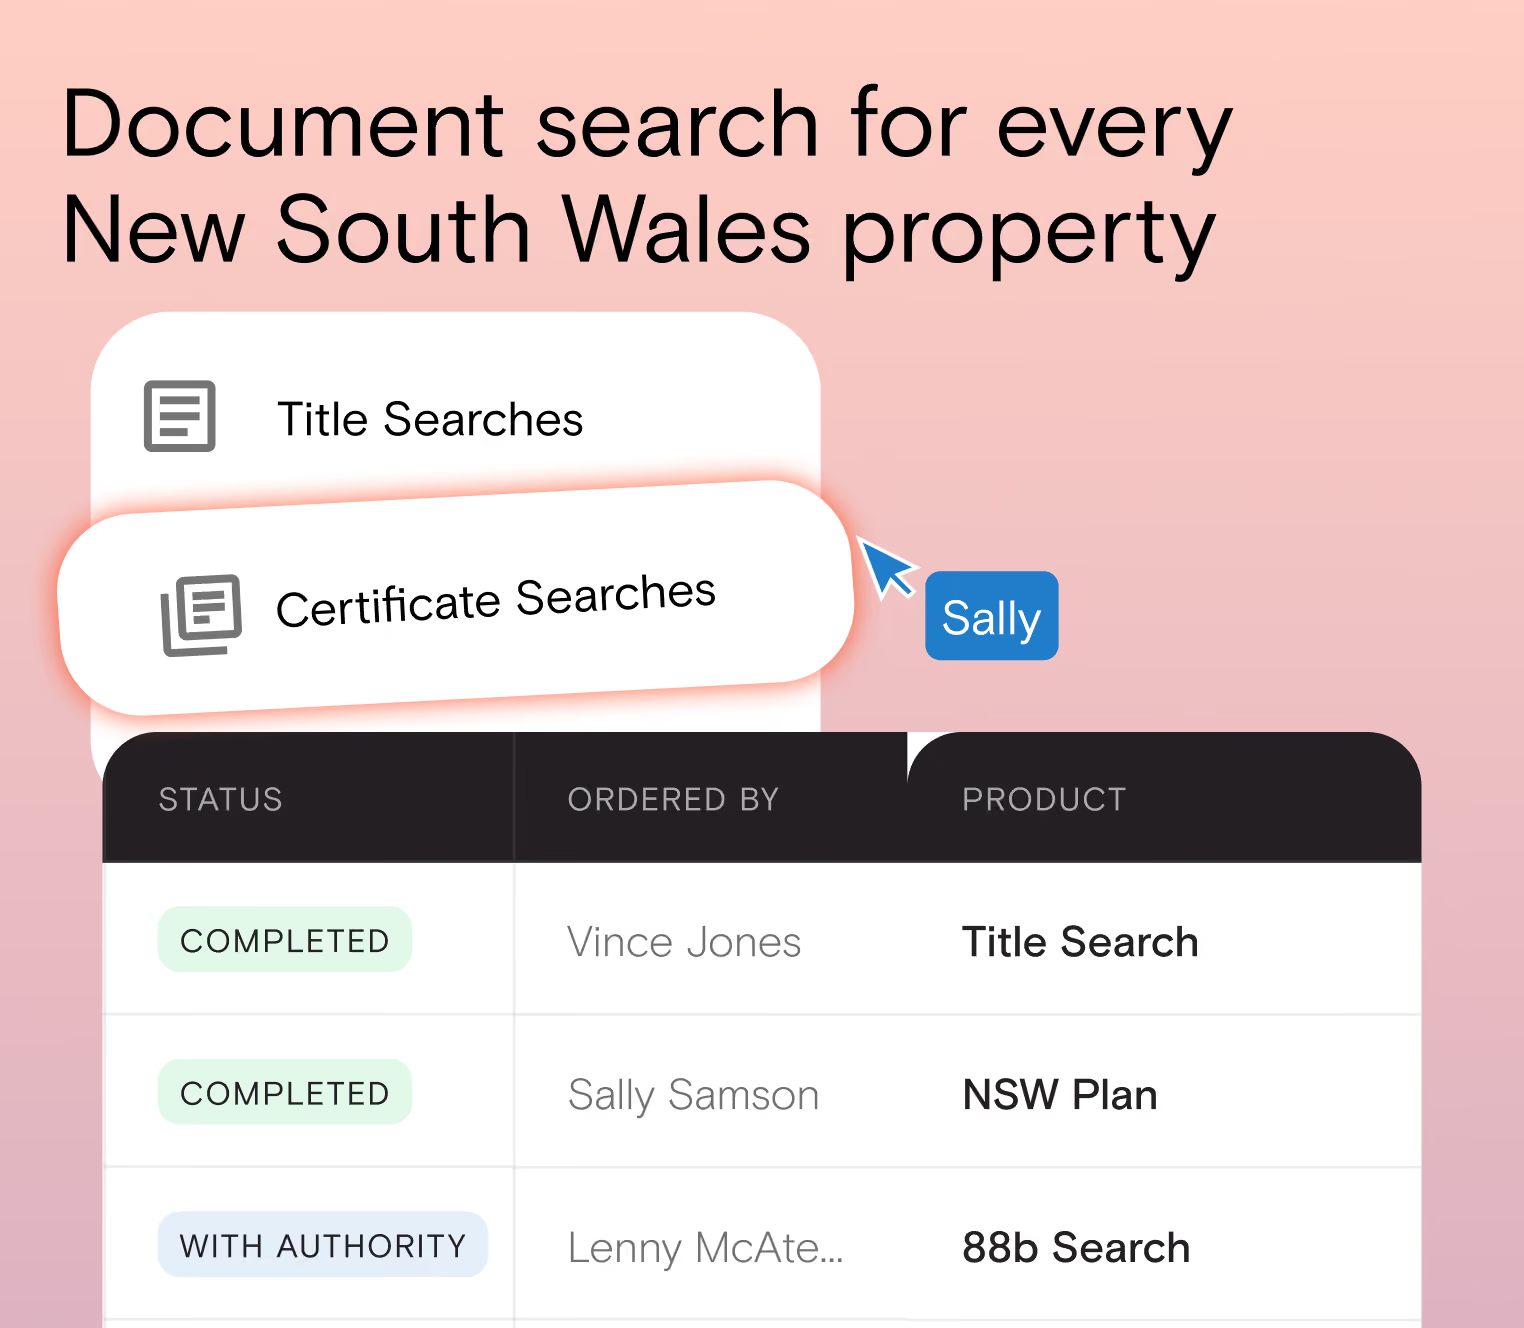
User interface showing document search options for New South Wales properties with ‘Title Searches’ and ‘Certificate Searches’ highlighted. A table below lists document status, ordered by, and product columns with entries: Completed by Vince Jones for Title Search, Completed by Sally Samson for NSW Plan, and With Authority by Lenny McAte for 88b Search.

How to Order NSW Documents

There are three routes, and all of them are straightforward:
  1. From the map - Search the address, open the Documents tab in the right-hand panel, and tick the documents you want to add them to your cart.
  2. Document Searches page - Select NSW, then search by address, lot/plan number or title reference.
  3. Standard Searches page - Select NSW, add a job reference, and search using the reference format for that document type.
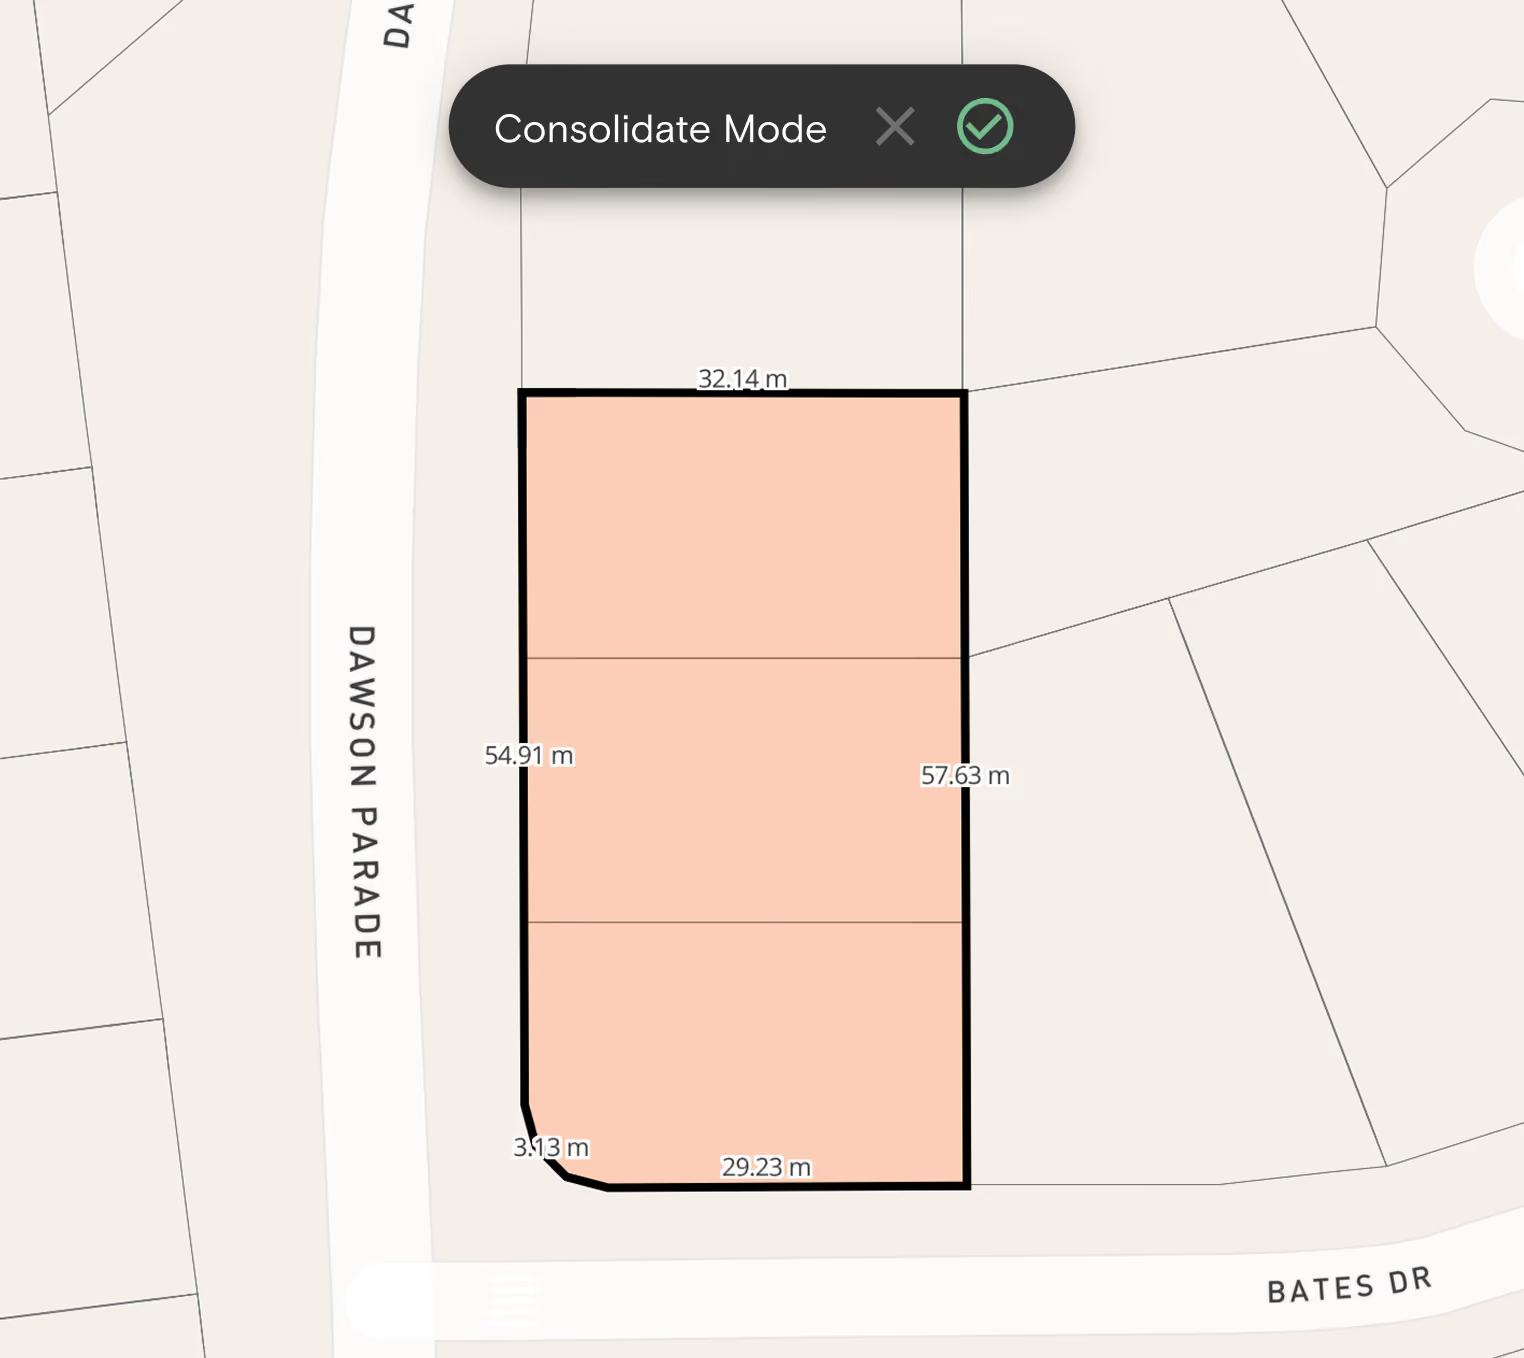
If you only need a single document, Buy Now lets you skip the cart and checkout entirely and order it in one step. Once you've placed your order we manage the rest, delivering instantly by email and uploading a copy to your order manager. Invoicing is issued monthly with 14-day payment terms, and if you purchase in high volume, contact us about enterprise document rates.

Site Finder in New South Wales

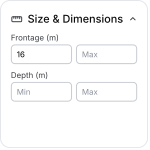
Site Finder narrows NSW down to a shortlist of sites that meet your criteria. Choose New South Wales from the state dropdown and stack the filters you need:
Get Started
User interface panel titled Size & Dimensions with input fields for Frontage (m) showing 16 in minimum field and an empty maximum field, and Depth (m) with empty minimum and maximum fields.
Location
Search by state, municipality, suburb or statistical area (SA1–SA4), one area or several at once
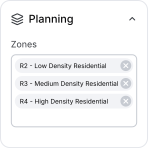
User interface panel titled Planning showing zones with three options: R2 - Low Density Residential, R3 - Medium Density Residential, and R4 - High Density Residential, each with a remove button.
Zone
Return only properties zoned for your intended use, drawn from the same NSW LEP zoning data you see on the map
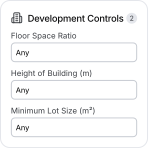
User interface panel titled Development Controls with three input fields labeled Floor Space Ratio, Height of Building (m), and Minimum Lot Size (m²), each showing the value 'Any'.
Development Controls
Search by range for floor space ratio, height of building and minimum lot size, so you can sweep for sites that meet a yield threshold rather than checking them one by one
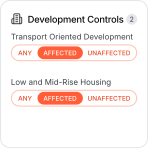
Interface panel titled Development Controls with two sections: Transport Oriented Development and Low and Mid-Rise Housing, each with options labeled ANY, AFFECTED (highlighted), and UNAFFECTED.
Low and Mid-Rise Housing and TOD
Return any property, or narrow to only those affected or unaffected by LMR or Transport Oriented Development
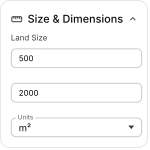
User interface panel titled 'Size & Dimensions' with input fields labeled 'Land Size' containing values 500 and 2000, and a unit selector set to square meters.
Land Size Range
Set a minimum and maximum size frontsge and depth in square metres, acres or hectares
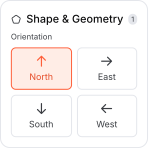
A UI panel titled 'Shape & Geometry' with a section labeled 'Orientation' displaying four direction buttons: North (highlighted in orange with an upward arrow), East (right arrow), South (down arrow), and West (left arrow).
Orientation
Filter by north, south, east or west-facing frontage
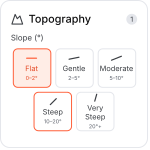
Topography slope options with icons and angle ranges: Flat 0-2°, Gentle 2-5°, Moderate 5-10°, Steep 10-20°, Very Steep 20° and above. Flat and Steep are highlighted in orange.
Slope
Surface or exclude sloping sites based on your construction and cost tolerance
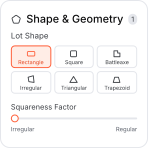
Interface section titled Shape & Geometry with options for Lot Shape including Rectangle, Square, Battleaxe, Irregular, Triangular, and Trapezoid; Rectangle is selected. Below is a Squareness Factor slider ranging from Irregular to Regular with the slider set near Irregular.
Shape and Geometry
Filter by lot depth, squareness factor and regular or irregular shape to assess buildable area and setback requirements
Our customers

The complete property intelligence platform

Source, assess and acquire your next development site
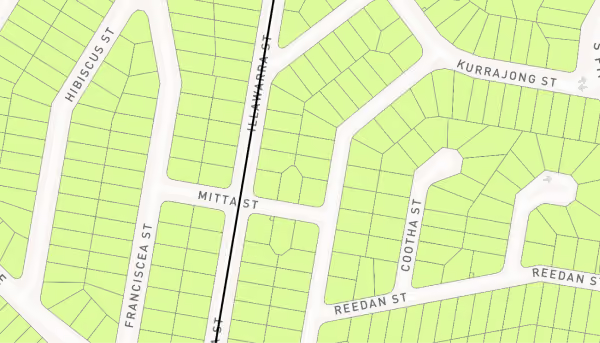
Title, planning controls, sales evidence and six-times-satellite aerial imagery in a single platform, so a NSW valuation doesn't mean five browser tabs and a document order somewhere else. Historical imagery lets you verify what was on site at a date, not just what's there now.
Find your next site
Filter an entire NSW LGA down to a shortlist on zone, land size and frontage, then check height, floor space ratio and minimum lot size on each candidate to see what actually stacks up. With HDA and SSD activity mapped alongside council DAs, you can also see which nearby sites have already been declared State Significant before you commit to a pathway.
Find the right information for you client
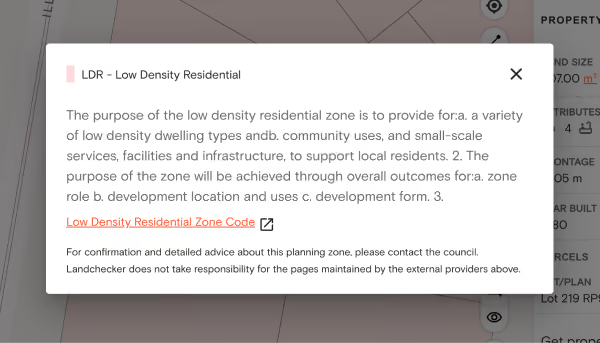
Order NSW titles, dealings, plans and 88B instruments without leaving the file you're working on, with most searches fulfilled instantly and a copy saved to your order manager. The free sub folio inquiry alone saves the back-and-forth of chasing title references across a strata or community scheme.
Everything you need - in one place
Every development standard that shapes a design — zone, height, FSR, minimum lot size, Low and Mid-Rise classification — sits on one map against one parcel, current as gazetted. Nearby approved and refused DAs give you the precedent to argue a scheme rather than guess at it.
One place for planning data across every Local Government Area
Know before the appraisal whether a listing sits in an LMR or Transport Oriented Development area, because upside changes the conversation with a vendor. Sales history, comparables and boundary data back up the number you put in front of them.
Monitor your portfolio
One source for NSW planning, boundaries, hazards, sales and registry documents, updated daily and gazetted changes reflected the next day. Save what matters into Projects and share it with the people who need it.
See your properties data in one easy to use platform
Check your zoning, boundaries, land size and whether your street falls inside a Low and Mid-Rise Housing area, free, in about a minute. If you're buying, order a NSW title before you sign to see exactly what easements, covenants or caveats sit over the land.

Want to make faster, insight-driven property decisions? Join Landchecker for free today.