Ourimbah NSW 2258
This Ourimbah suburb profile includes demographic data and planning information to help you make an informed property decision.
An average home in Ourimbah is owned with a mortgage by couples with children. The average age in Ourimbah is 37. Separate houses are common in Ourimbah and the area is mostly Forestry (34.66%), National Parks And Nature Reserves (33.88%) and Environmental Conservation (18.88%).
Ourimbah demographics
Population
3951
Average Age
37
Age Distribution
Employment Type
Median Weekly Income
Traveled to Work
Car
85.4%
Tram
0.0%
Bicycle
0.3%
Train
4.9%
Walking
1.4%
Bus
0.6%
Ourimbah property information
Number of Bedrooms
Tenure Type
Property Types in Ourimbah
Separate house
Semi detached house
Unit/Apartment
Median monthly mortgage repayments
$1,733
Median weekly rental payments
$345
Average number of bedrooms per dwelling
3.4
Average number of people per household
3
Household Composition
Family Composition
Couple family without children
One parent family
Couple family with children
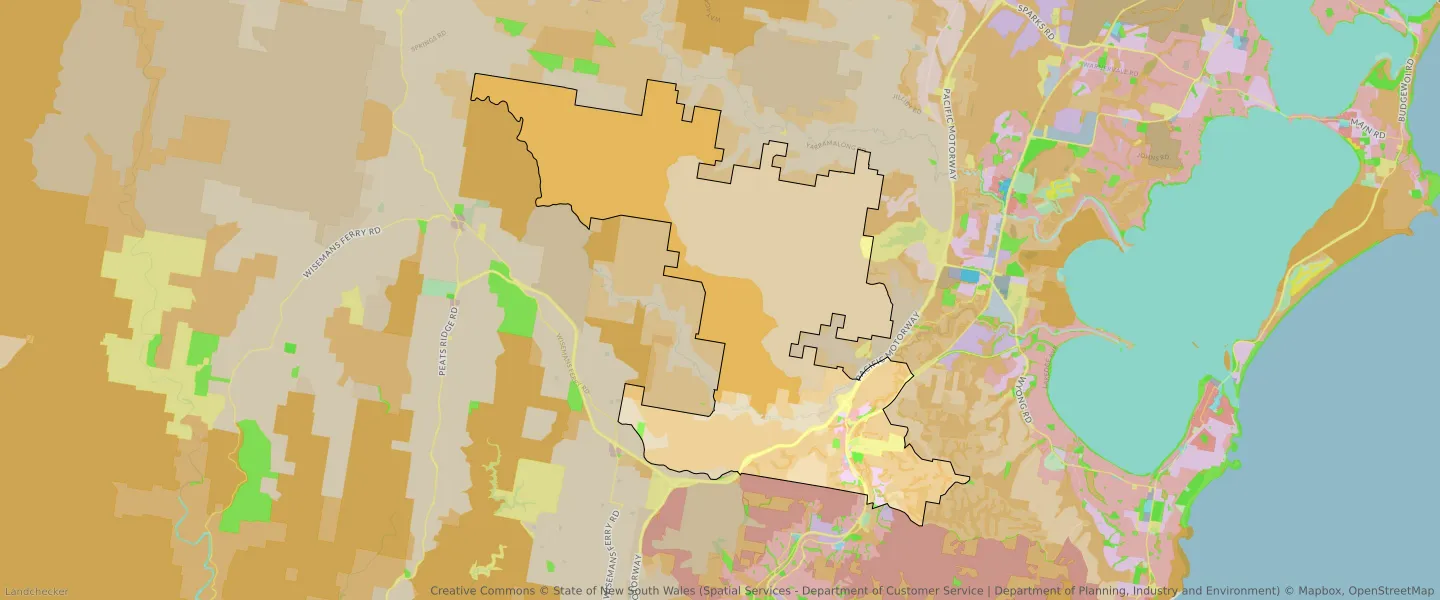
Ourimbah planning zones
| Zone Code | Zone Name | Percentage Covered | Area Covered | |
|---|---|---|---|---|
| RU3 | Forestry | 34.66% | 30,306,379㎡ | |
| C1 | National Parks And Nature Reserves | 33.88% | 29,630,601㎡ | |
| C3 | Environmental Conservation | 18.88% | 16,497,891㎡ | |
| RU1 | Primary Production | 3.3% | 2,882,787㎡ | |
| SP2 | Infrastructure | 2.86% | 2,497,529㎡ | |
| C2 | Environmental Conservation | 2.04% | 1,782,188㎡ | |
| C4 | Environmental Living | 1.62% | 1,418,975㎡ | |
| RU2 | Rural Landscape | 0.99% | 867,368㎡ | |
| R1 | General Residential | 0.81% | 706,431㎡ | |
| RE1 | Low Density Residential | 0.44% | 384,923㎡ | |
| R2 | Environmental Living | 0.37% | 321,642㎡ | |
| E4 | General Industrial | 0.1% | 91,511㎡ | |
| E1 | Local Centre | 0.02% | 19,535㎡ | |
| RE2 | Private Recreation | 0.01% | 12,105㎡ | |
| DM | Deferred Matter | 0% | 12㎡ |
Looking to research a property in OURIMBAH?
Go to mapData Source - ABS