Jolimont WA 6014
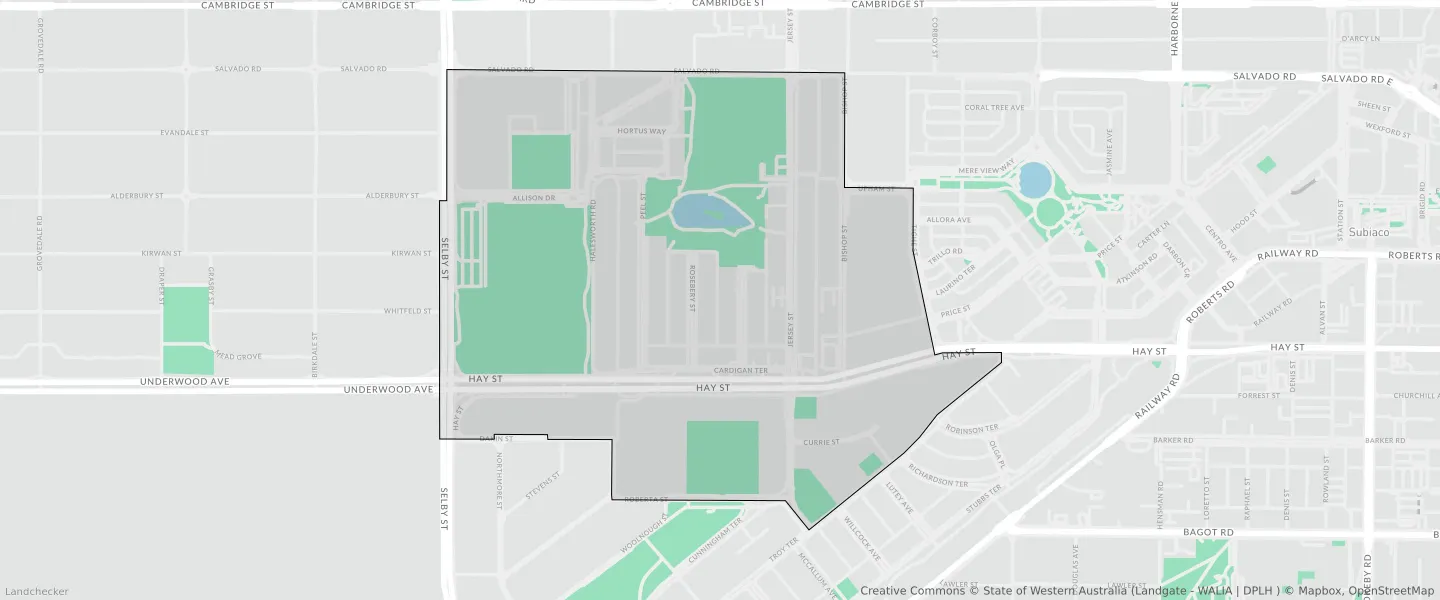
This Jolimont suburb profile includes demographic data and planning information to help you make an informed property decision.
An average home in Jolimont is rented by single person households. The average age in Jolimont is 52. Units and Apartments are common in Jolimont and the area is mostly URBAN ZONE (78.71%), URBAN (78.71%) and RESIDENTIAL (25.51%).
Jolimont demographics
Population
1479
Average Age
52
Age Distribution
Employment Type
Median Weekly Income
Traveled to Work
Car
70.1%
Tram
0.0%
Bicycle
3.4%
Train
7.5%
Walking
5.9%
Bus
5.5%
Jolimont property information
Number of Bedrooms
Tenure Type
Property Types in Jolimont
Separate house
Semi detached house
Unit/Apartment
Median monthly mortgage repayments
$2,178
Median weekly rental payments
$300
Average number of bedrooms per dwelling
2.3
Average number of people per household
2
Household Composition
Family Composition
Couple family without children
One parent family
Couple family with children
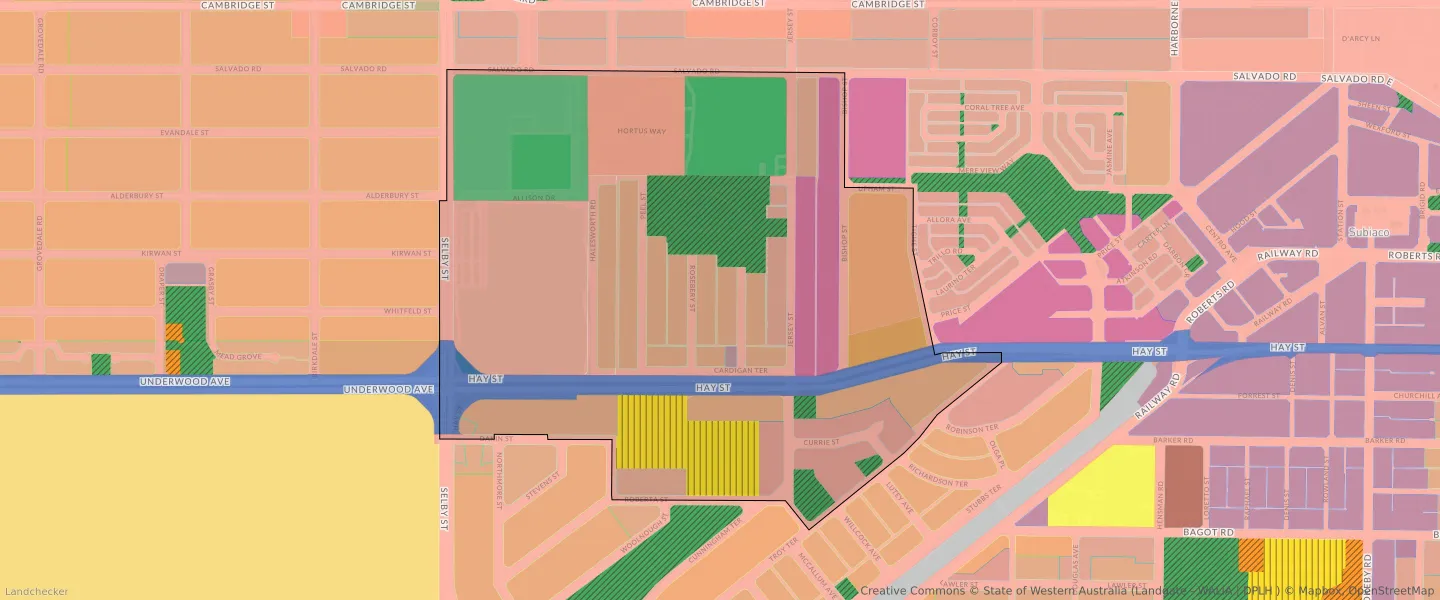
JOLIMONT planning zones
| Zone Code | Zone Name | Percentage Covered | Area Covered | |
|---|---|---|---|---|
| EDUCATION | EDUCATION | 5.58% | 42,917.29㎡ | |
| LOCAL CENTRE | LOCAL CENTRE | 0.12% | 945.2㎡ | |
| LOCAL ROAD | LOCAL ROAD | 1.21% | 9,305.67㎡ | |
| MIXED USE | MIXED USE | 6.59% | 50,717.86㎡ | |
| NO ZONE | NO ZONE | 9.87% | 75,957.91㎡ | |
| NO ZONE | NO ZONE | 12.19% | 93,807.42㎡ | |
| OTHER REGIONAL ROADS | OTHER REGIONAL ROADS RESERVE | 6.96% | 53,507.93㎡ | |
| PUBLIC OPEN SPACE | PUBLIC OPEN SPACE | 6.6% | 50,770.14㎡ | |
| R100 | R100 | 5.76% | 44,322.08㎡ | |
| R160 | R160 | 4.1% | 31,554.53㎡ | |
| R20 | R20 | 12.29% | 94,546.01㎡ | |
| R30 | R30 | 1.19% | 9,129.46㎡ | |
| R35 | R35 | 1% | 7,729.08㎡ | |
| R50 | R50 | 1.43% | 11,032.81㎡ | |
| R60 | R60 | 0.12% | 945.57㎡ | |
| R80 | R80 | 3.89% | 29,940.98㎡ | |
| R-AC3 | R-AC3 | 5.3% | 40,735.29㎡ | |
| REGIONAL OPEN SPACE | REGIONAL OPEN SPACE | 14.33% | 110,239.25㎡ | |
| REGIONAL OPEN SPACE | REGIONAL OPEN SPACE RESERVE | 14.33% | 110,239.25㎡ | |
| RESIDENTIAL | RESIDENTIAL | 7.95% | 61,152.74㎡ | |
| RESIDENTIAL | RESIDENTIAL | 25.51% | 196,227.86㎡ | |
| URBAN | URBAN | 78.71% | 605,533.81㎡ | |
| URBAN | URBAN ZONE | 78.71% | 605,533.81㎡ |
Looking to research a property in JOLIMONT?
Go to mapData Source - ABS