Gwelup WA 6018

This Gwelup suburb profile includes demographic data and planning information to help you make an informed property decision.
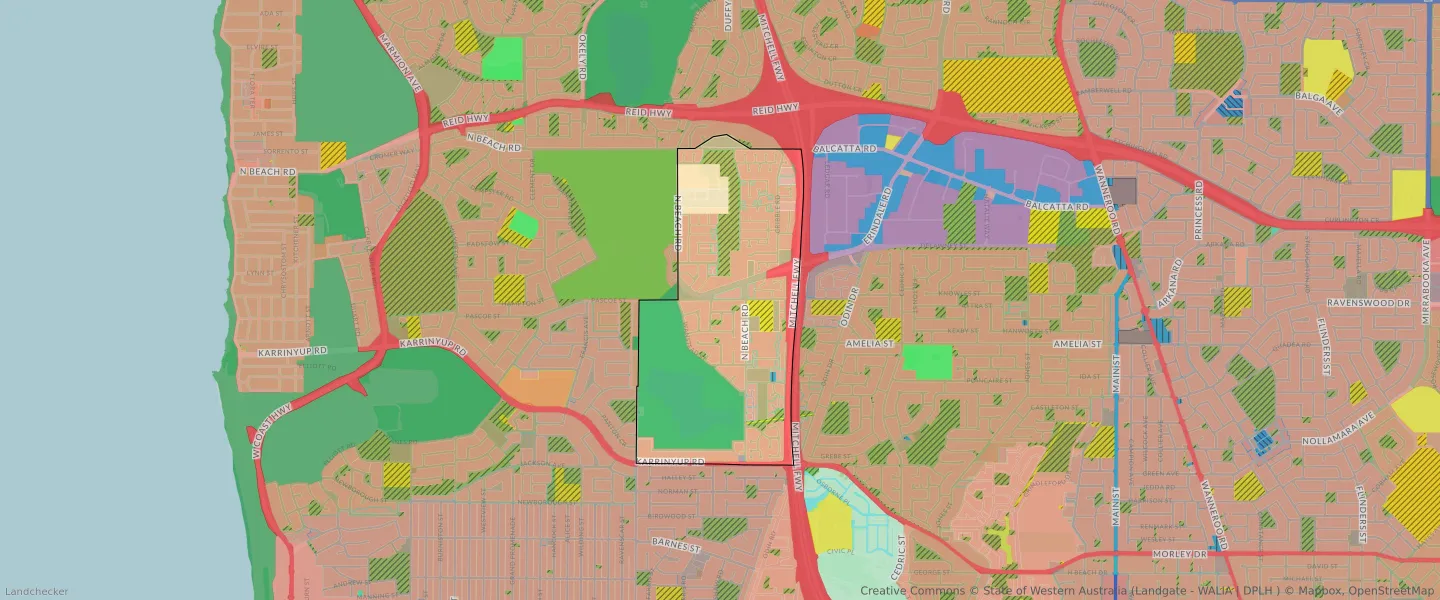
An average home in Gwelup is owned with a mortgage by couples with children. The average age in Gwelup is 42. Separate houses are common in Gwelup and the area is mostly URBAN ZONE (61.59%), URBAN (61.59%) and R20 (52.93%).
Gwelup demographics
Population
5391
Average Age
42
Age Distribution
Employment Type
Median Weekly Income
Traveled to Work
Car
85.3%
Tram
0.0%
Bicycle
1.4%
Train
3.4%
Walking
1.1%
Bus
0.8%
Gwelup property information
Number of Bedrooms
Tenure Type
Property Types in Gwelup
Separate house
Semi detached house
Unit/Apartment
Median monthly mortgage repayments
$2,600
Median weekly rental payments
$600
Average number of bedrooms per dwelling
3.5
Average number of people per household
3
Household Composition
Family Composition
Couple family without children
One parent family
Couple family with children
GWELUP planning zones
| Zone Code | Zone Name | Percentage Covered | Area Covered | |
|---|---|---|---|---|
| BUSINESS | BUSINESS | 0.11% | 3,229.49㎡ | |
| DEVELOPMENT | DEVELOPMENT | 5.38% | 157,618.94㎡ | |
| LOCAL CENTRE | LOCAL CENTRE | 0.71% | 20,756.34㎡ | |
| PRIMARY REGIONAL ROADS | PRIMARY REGIONAL ROADS RESERVE | 7.8% | 228,651.27㎡ | |
| PRIVATE INSTITUTION | PRIVATE INSTITUTION | 0.84% | 24,765.79㎡ | |
| PUBLIC OPEN SPACE AND LOCAL AUTHORITY PURPOSES | PUBLIC OPEN SPACE AND LOCAL AUTHORITY PURPOSES | 5.74% | 168,264.13㎡ | |
| PUBLIC USE | PUBLIC USE | 1.4% | 41,096.13㎡ | |
| R20 | R20 | 52.93% | 1,551,433.61㎡ | |
| R25 | R25 | 0.66% | 19,487.96㎡ | |
| R30 | R30 | 2.3% | 67,392.16㎡ | |
| R35 | R35 | 0.32% | 9,352.48㎡ | |
| R40 | R40 | 0.55% | 16,220.87㎡ | |
| REGIONAL OPEN SPACE | REGIONAL OPEN SPACE | 25.08% | 735,271.33㎡ | |
| REGIONAL OPEN SPACE | REGIONAL OPEN SPACE RESERVE | 25.08% | 735,271.33㎡ | |
| RESIDENTIAL | RESIDENTIAL | 34.77% | 1,019,262.78㎡ | |
| SERVICE STATION | SERVICE STATION | 0.07% | 2,005.02㎡ | |
| SPECIAL USE | SPECIAL USE | 2.97% | 87,082.05㎡ | |
| URBAN | URBAN | 61.59% | 1,805,488.67㎡ | |
| URBAN | URBAN ZONE | 61.59% | 1,805,488.67㎡ | |
| URBAN DEFERRED | URBAN DEFERRED ZONE | 5.52% | 161,898.52㎡ |
Looking to research a property in GWELUP?
Go to mapData Source - ABS